2024-09-30
EngineeringHighcharts + Blazor SSR: Interactive Charts Built in C#
Previously we explored using the Aggregations.io API to build a simple query builder interface. Today we’ll take the next step to actually chart the results. Charts/graphs/plots are one of the most crucial elements to have interactive on your site. Arriving at a page with a statically rendered chart, no ability to zoom or hover or get tooltips - is an instant turnoff.
If you’re using Blazor in an interactive render mode, there are numerous options for charting that interop with a JS library. The go-to library we use is Plotly.Blazor. It may not be the prettiest, but it has the best perf we’ve seen.
Our Goal
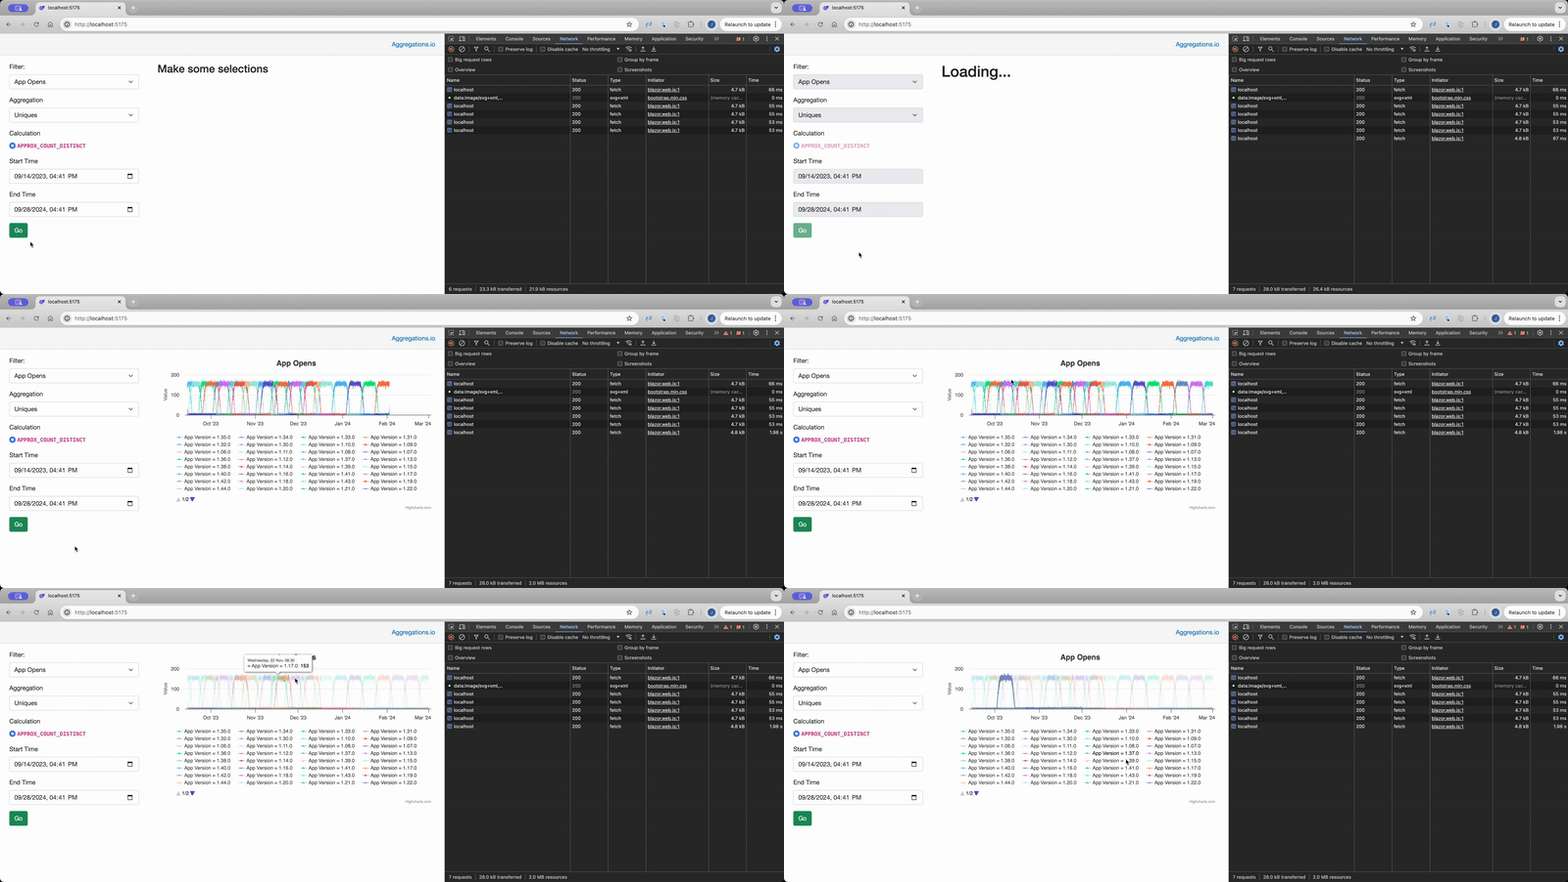
Following up from the previous post, since we have our query builder that returns results, we need to display them. Ideally, we write as little javascript as possible and the displayed form is interactive (and updates natively when the results change).

Code
Here’s the PR for the update. There’s not a ton of new code, but we’ll walk through the primary changes.
Highcharts Dotnet
Firstly, you might notice we’ve changed the project file to include a reference to the Highcharts nuget package. This is what enables us to add interactivity. Highcharts is a fantastic and well established charting library I’ve used for almost a decade on various projects. While it’s a predominantly a JS libray, they also have a Dotnet package that allows you to construct chart objects using native C# types. In order to support the library, we also add the JS on the main App.razor page.
Constructing the chart
Taking a look at our new HighchartsContainer.razor.cs file:
We have 2 parameters.
    [Parameter, EditorRequired] public List<AggregationsResult> Results { get; set; } = null!;
    [Parameter, EditorRequired] public FilterSetupContext ctx { get; set; } = null!;
The EditorRequired attribute ensures we don’t accidentally forget to set an attribute.
There’s only one method on this component, because we only need to set up our HighchartsRenderer when the component is initialized.
We start by transforming the results from Aggregations.io into a grouped set, so that we can display groupings separately on the chart. We then need to transform those groupings into Series objects for Highcharts.
var groupedData = Results.GroupBy(aggResult =>
{
    if (aggResult.groupings != null)
    {
        var humanReadable = aggResult
            .groupings
            .OrderBy(Grouping => Grouping.Key)
            .ThenBy(Grouping=> Grouping.Value)
            .Select(Grouping => $"{Grouping.Key} = {Grouping.Value}");
        return string.Join(", ",humanReadable );
    }
    return string.Empty;
});

var serieses = new List<Series>();

foreach (var grouping in groupedData)
{
    serieses.Add(new LineSeries()
    {
        Name = grouping.Key,
        Data = grouping.Select(aggResult => new LineSeriesData()
        {
            Y = aggResult.value,
            X = new DateTimeOffset(aggResult.dt).ToUnixTimeMilliseconds()
        }).ToList()
    });
}
Let’s walk through some key lines:
-
9-10: If there are any groupings, we want a consistent human-readable format. For this basic example, we do
Key = Value, so you can imagine, if your groupings are OS and Browser, you might end up withBrowser = Chrome, OS = Windows,Browser = Edge, OS = Windows,Browser = Safari, OS = MacOSas your series names. -
15: With Highcharts, you can visualize data in many different ways. Each series type will inherit from the base
Seriesclass and the final chart object takes aList<Series>as input. So we need to create one. -
19-26: We’re transforming the grouped data points into a new
LineSeries. Since Highcharts X values for dates expect ms since the unix epoch, we need to go through theDateTimeOffsetto get it (for simplicity).
The remainder of the initialization code simply applies various Highcharts options to control different rendering/layout/features. Pretty much all of these map to the JS options, but strongly typed in your C# code.
At the end there is one important options to take note of:
chartOptions.ID = "chart";
Very descriptive, right? This is the ID that the highcharts library will use for the div that gets rendered. If you’re rendering multiple charts on a page or doing anything more “serious” - you’ll probably want to control this more tightly.
Rendering the chart
The frontend of our new component, HighchartsContainer.razor is very simple.
@if (renderer != null)
{
    @((MarkupString)renderer.RenderHtml())
}
We ensure initialization completed successfully (because renderer is not null) and then we call the RenderHtml() method from Highcharts.
We cast the output as a MarkupString because we want the engine to retain the raw html from the renderer. This is not the most eloquent solution, but it gets the job done!
If you check out the output of that container in your dev tools, you’ll see a fully formed <div> and <script> tag, as if you were setting up Highcharts manually. But it was rendered on the server, and streamed down to the browser.
A little bit of Javascript
As mentioned in the previous post, we have some javascript to enable interactivity. In this change, we are adding a check to the enhancedload listener for the newly created “chart” div. See the change here.
If an element with the id of “chart” appears after an ehanced load, we call createChartchart(). This function is generated based on the ID we assigned in our Highcharts option. The rendered HTML includes a script tag, with the function createChart{CHART_ID}.
Conclusion
We now have added a very basic interactive chart to our query tester. It draws series for each grouping returned by the API. This is all still powered by Blazor SSR, with only a few lines of JS involved. Is this the most robust solution? Of course not! But it works, and it’s a great starting point to build a more full featured product.
Keep an eye on the Blazor Demos repo, and add a ⭐️ to get notified as we add more Blazor content.

