#
Analytics Without Events: Ingesting & Analyzing Changes from DynamoDB
Analyzing changes generated by DynamoDB can be an efficient and easy way to gather metrics and insights, without the overhead of additional infrastructure or code. This guide will take a look at one such example, HTML/CSS To Image API (HCTI). We'll walk through their setup from the AWS console all the way to their Grafana panels, so you can set up a similar integration.
HCTI provides a service to turn your HTML & CSS into an image. For scalability, they've chosen DynamoDB as their primary data store. They don't currently have granular analytics implemented in their application. They have been using Aggregations.io to build both internal monitoring and improvements to their customer dashboards. We'll review internal monitoring today and a future guide will dive into the customer dashboard usecase.
#
Setup
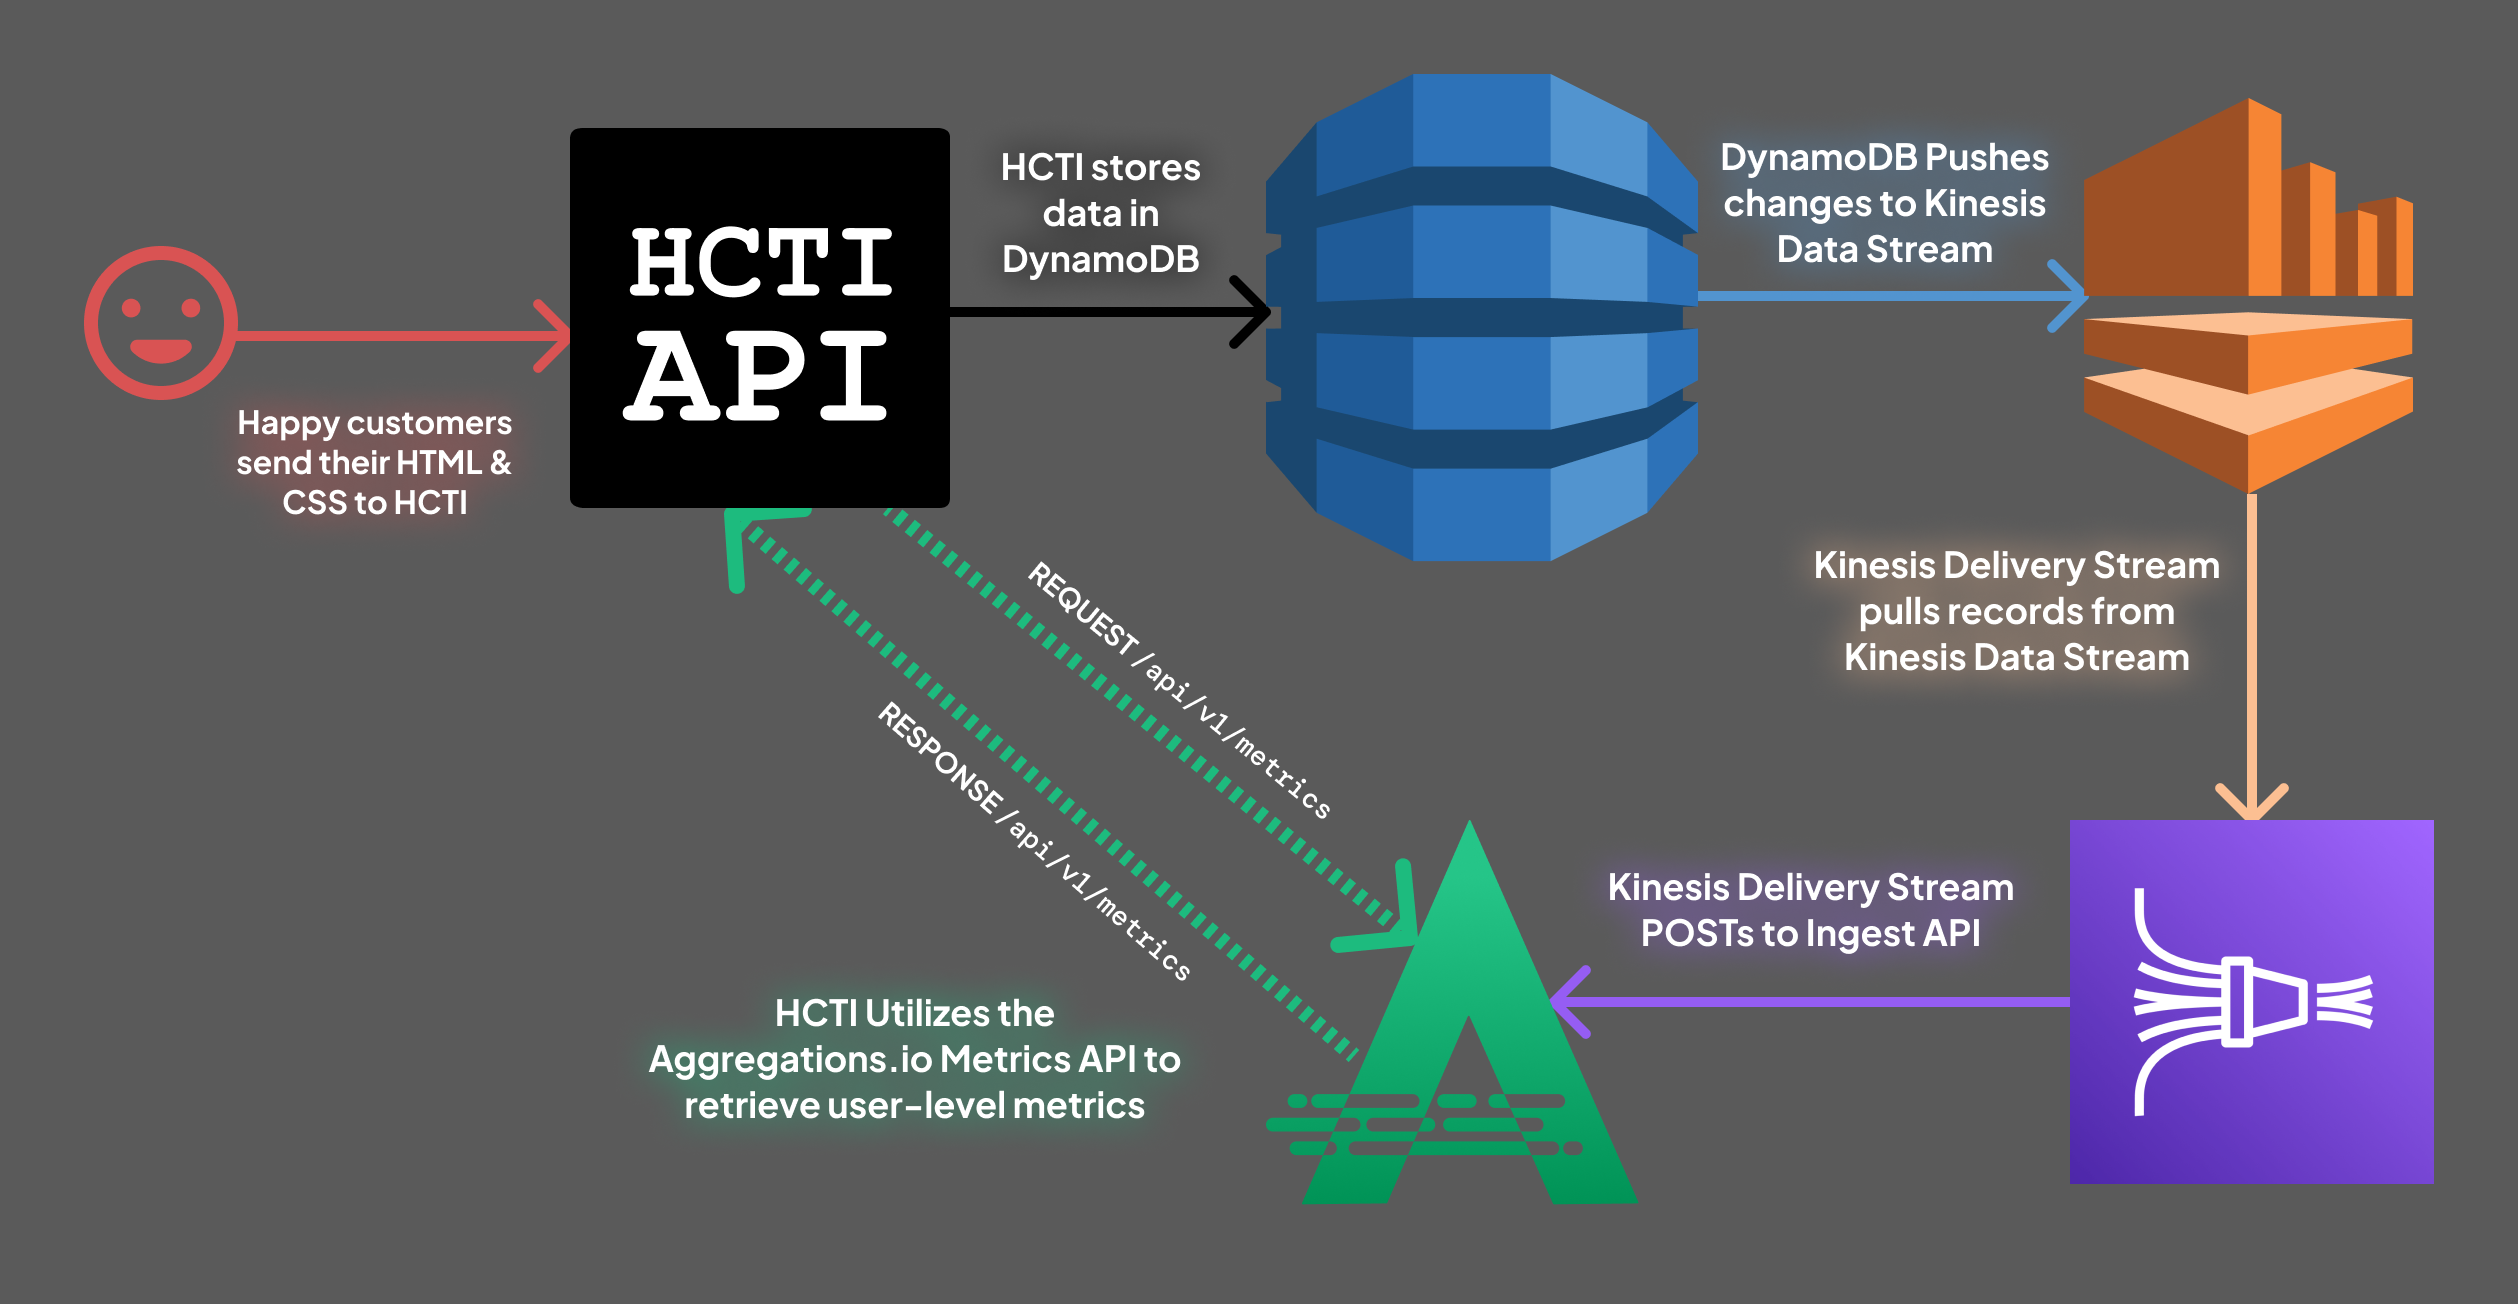
The full flow of data, will look like this:
#
Enabling DynamoDB Streams
The first step in the process is enabling DynamoDB Streams, to pipe change events from Dynamo to Kinesis to Aggregations.io. On the AWS Console, locate the source DynamoDB table. In this case, the necessary table is called hcti-images, where HCTI stores its images.
Select the Exports and Streams tab and locate the middle section that says Amazon Kinesis data stream details
For this guide we'll be utilizing Kinesis Data Streams. This provides a straightforward and easy setup, but has some downsides, mainly additional latency and cost. A similar result can be achieved by utilizing DynamoDB streams and AWS Lambda or a similar worker service, POSTing data to Aggregations ingest API directly.
The next step is to create a new Kinesis stream. We'll also go ahead and create a new Kinesis Delivery Stream (Firehose) that reads from the newly created Kinesis Data Stream.
For more in depth instructions on setting up a connection from Kinesis to Aggregations.io, check out the integration guide.
#
The Data Structure
If you've never looked at the way DynamoDB represents data, either in exports or stream events, it can be a little jarring. Each property in your stored documents are represented in a key value structure, where the key is the data type and the value is the value. So if you've got a property like user_id that is a string, the object looks like this:
{
    "user_id":{
        "S": "USER123"
    }
}
Thanks to the flexibility of Aggregations.io, this is no problem.
Looking at the structure of a DynamoDB Stream Record, It will look like the following:
When a new record is added to a table, you get an INSERT event, with the properties of your document inside the NewImage key.
{
    "awsRegion": "us-east-2",
    "eventID": "db49e517-6400-46fa-9bf0-beddd8d11e8e",
    "eventName": "INSERT",
    "userIdentity": null,
    "recordFormat": "application/json",
    "tableName": "hcti-images",
    "dynamodb": {
        "ApproximateCreationDateTime": 1703027891676,
        "Keys": {
            ...
        },
        "NewImage": {
             ...
        },
        "SizeBytes": 733
    },
    "eventSource": "aws:dynamodb"
}
When a record is updated, you get a MODIFY event, with the properties from the original document inside the OldImage key and the new values inside the NewImage key.
{
    "awsRegion": "us-east-2",
    "eventID": "97ef46a8-ea70-41b2-a736-9f95068c4622",
    "eventName": "MODIFY",
    "userIdentity": null,
    "recordFormat": "application/json",
    "tableName": "hcti-images",
    "dynamodb": {
        "ApproximateCreationDateTime": 1703099852336,
        "Keys": {
            ...
        },
        "NewImage": {
           ...
        },
        "OldImage": {
           ...
        },
        "SizeBytes": 1466
    },
    "eventSource": "aws:dynamodb"
}
There's a few key elements here:
- The
eventNameallows you to differentiateINSERTs fromMODIFYs. - The
tableNamecan be useful for filtering / grouping if you're feeding multiple tables' DynamoDB events into the same Kinesis stream. - Using
dynamodb.ApproximateCreationDateTimeis the approximate time in milliseconds of the event. We can use this as our custom timestamp when ingesting events.
#
HCTI's data structure
Looking specifically at HCTI, an INSERT event looks like this:
  "NewImage": {
            "ImageType": {
                "N": "0"
            },
            "user_id": {
                "S": "<REDACTED>"
            },
            "created_at": {
                "S": "2023-12-20T19:33:37.609Z"
            },
            "css": {
                "B": "SDRzSUFBQUFBQUFBQThvd1ZLaE96cy9KTDdKU05qSjFOcld3c0s0RkFBQUEvLzhEQUdOaXRYb1RBQUFB"
            },
            "html": {
                "B": "SDRzSUFBQUFBQUFBQTdKSnlTeXpVN0RKTUxSVDhNaFVDTWxJTFVyVlVmQlV6MVVJU1MwdXljeExWMGpMTDFKd1RFOHZTazFQTE1uTXp5dld5OHhYc05FSHFyZlJCMmtGQUFBQS8vOERBT3NoQlJCQUFBQUE="
            },
            "should_be_in_s3": {
                "BOOL": false
            },
            "external_data": {
                "BOOL": false
            },
            "google_fonts": {
                "S": "Roboto"
            },
            "image_id": {
                "S": "<REDACTED>"
            },
            "hcti_id_created_with": {
                "S": "<REDACTED>"
            },
            "compression": {
                "S": "gzip"
            }
        },
#
What to monitor?
There's a number of useful metrics that HCTI extracts using Aggregations.io. Diagnostic measures like Images created per Type and Customers creating large Images are useful for internal / tracking purposes. They can achieve performance gains by looking at popular google_fonts in use, and caching them. The examples go on, as they start piping in data from additional Dynamo tables as well.
#
Internal Monitoring
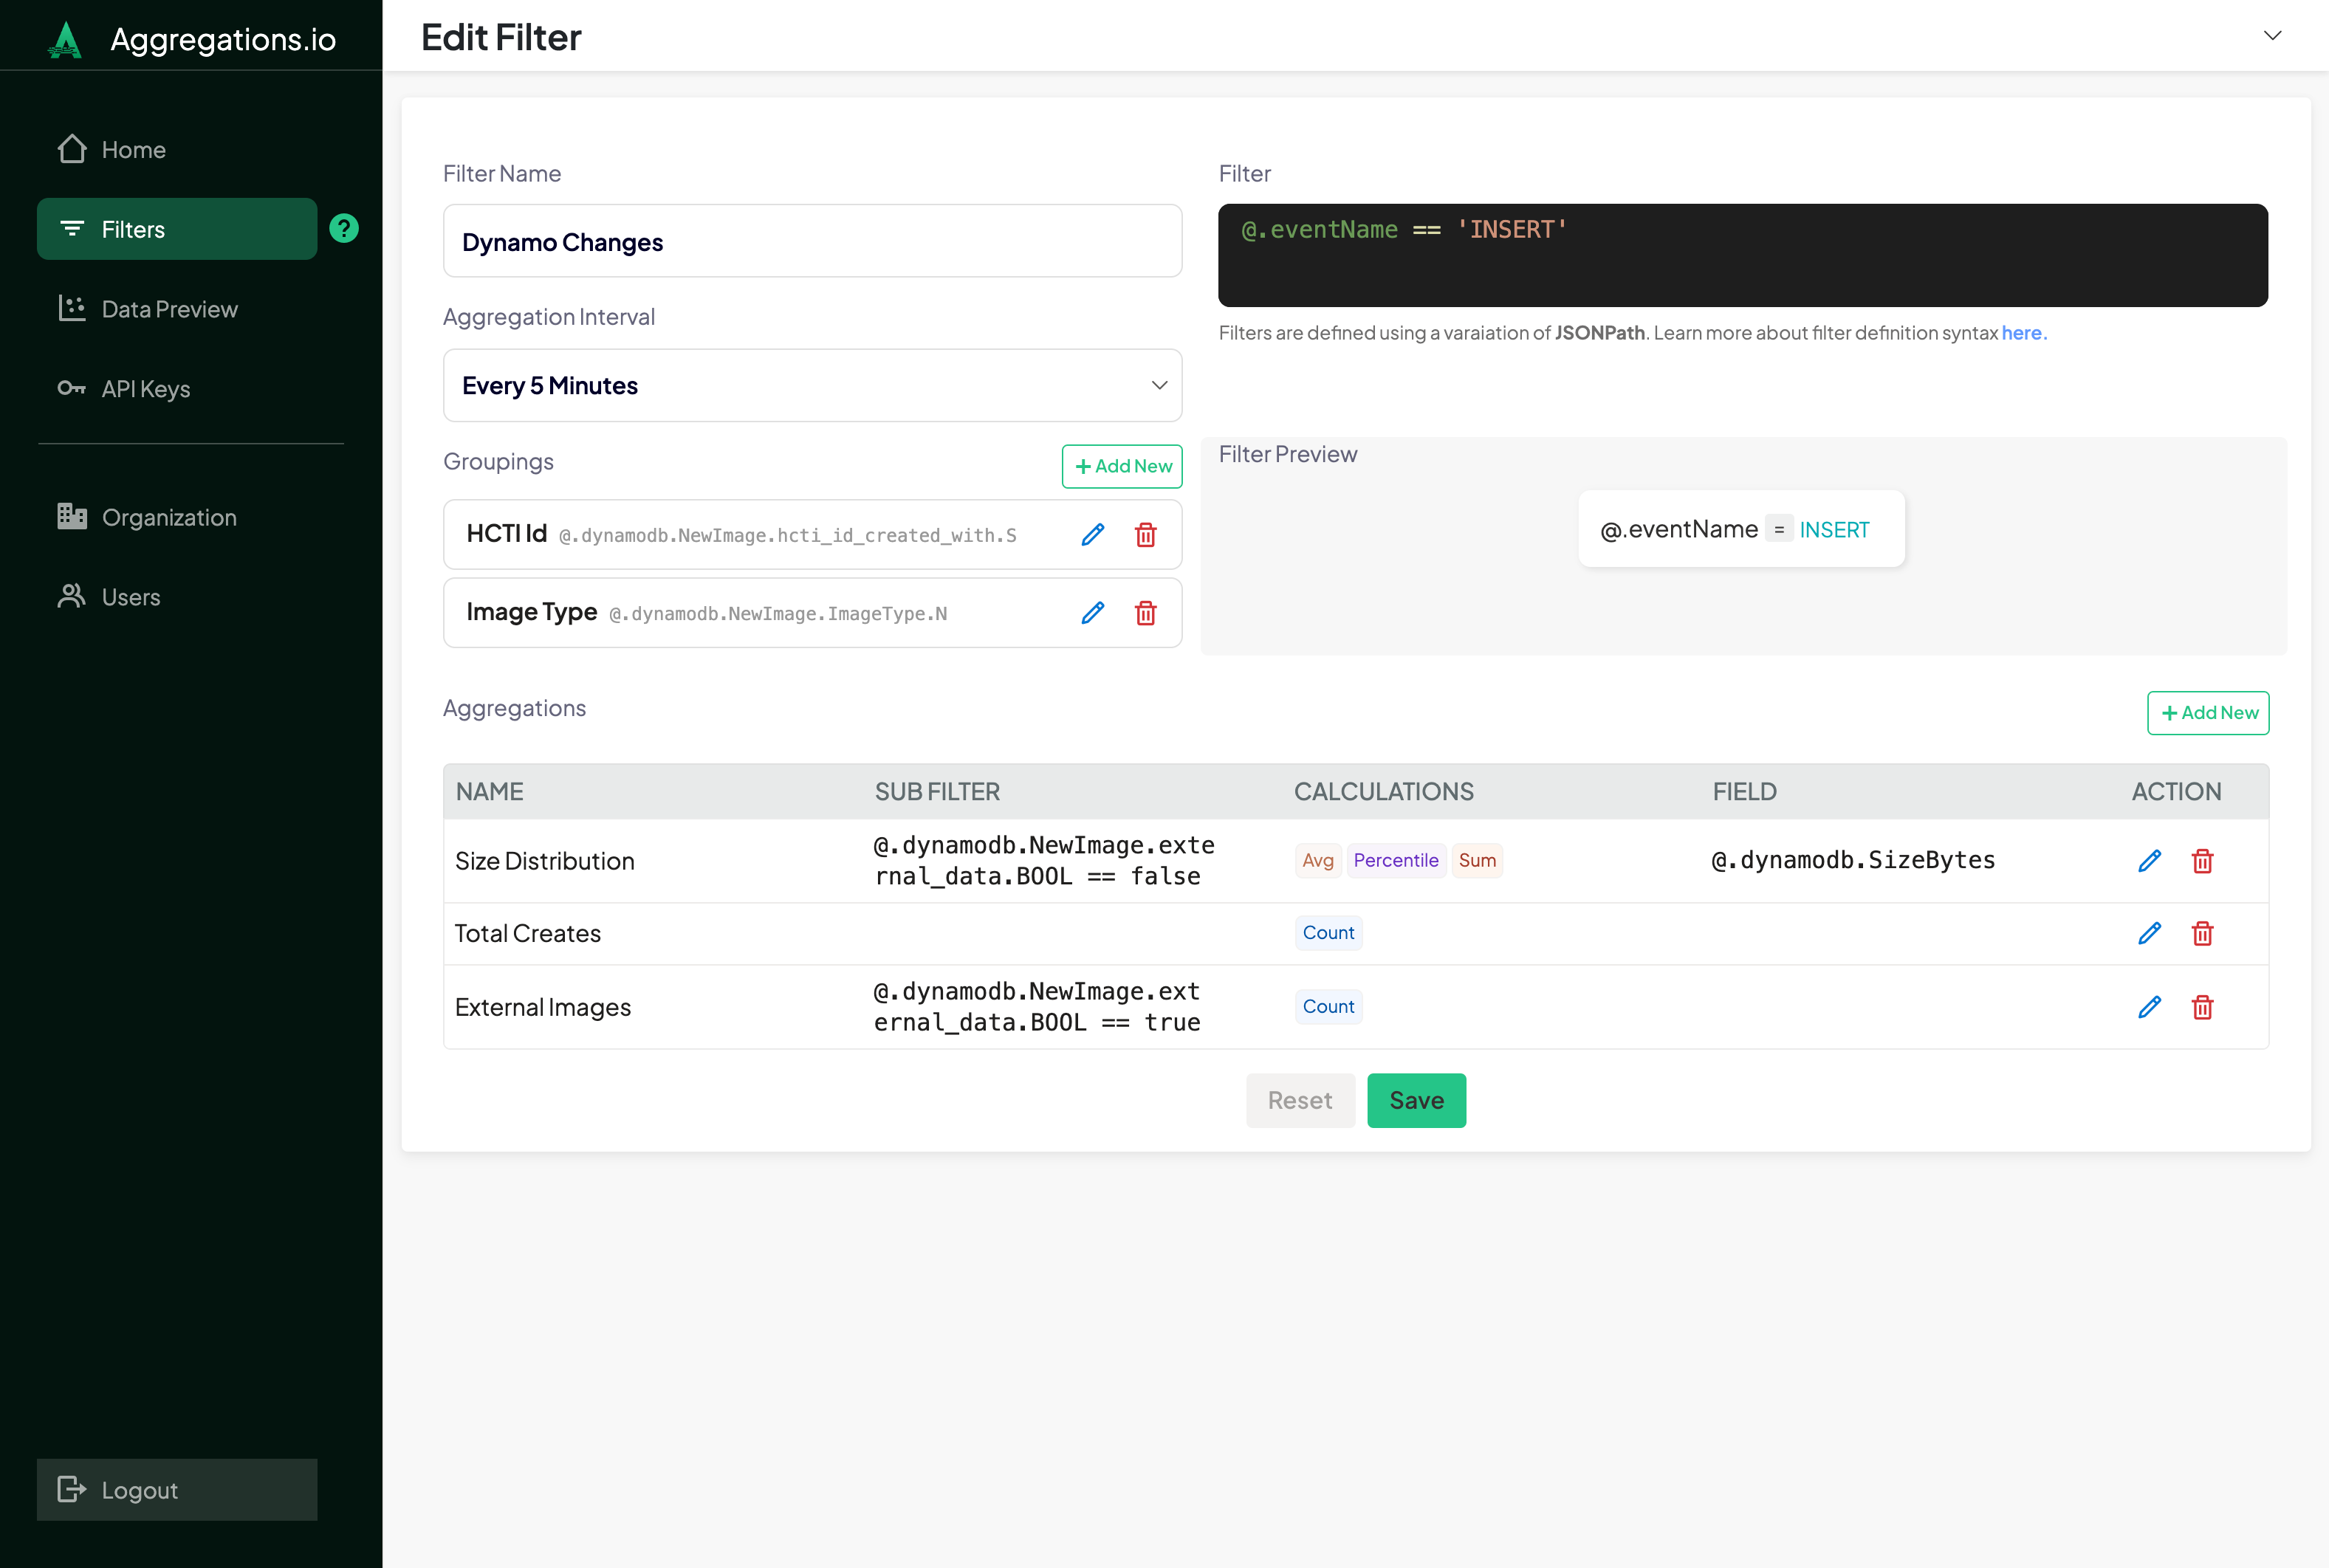
We're going to focus first on metrics derived from newly created images. The filter will simply be @.eventName == 'INSERT'
#
Groupings
Groupings enable monitoring different metrics, sliced by different parameters. To start simple and power the current usecases HCTI has, they add 2 to this initial filter:
#
Aggregations
#
Size Distribution
For HCTI, an element that is crucial to both performance and cost is the size of documents being inserted into Dynamo, which directly corresponds to the size and performance of the images being rendered. For this we want to pay attention to the handy SizeBytes field every Dynamo event includes.
We add calculations for Avg, Percentile and Sum to this aggregation, with a Sub-Filter of @.dynamodb.NewImage.external_data.BOOL == false (because external_data may skew the results down).
#
External Images
Similar to the above concerns on document Size, "External" data means the customer submitted so much HTML/CSS that it is too large to fit within a Dynamo record, even compressed. This is a rare occasion, but needs to be monitored for both cost and performance concerns.
They create a Count with a Sub Filter of @.dynamodb.NewImage.external_data.BOOL == true to count up documents with External Data.
Because the HCTI Id is in the groupings, they can also dig in when necessary and observe if new or abusive customers are causing issues.
#
Total Creates
To keep an eye on overall service activity, as well as breakdowns per Image Type & Customer - a simple Count with no Sub Filter is added.
#
Overview
The created Filter looks like this:
#
Grafana Dashboards
We're not going to dive into every panel here, check out the Grafana Docs or our other Use Cases for more panel examples.
We're going to explore 2 key elements here, the Overall Stat Panels and the Per-User lists.
#
Overall Stat Panels
By taking advantage of Recalculate Intervals, it becomes efficient and easy to build stat panels.
The goals are to have both an overall counter, as well as a breakdown per image type. To achieve this, create a new panel:
#
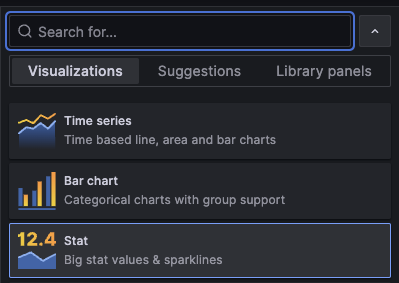
(1) Change the Visualization to Stat
#
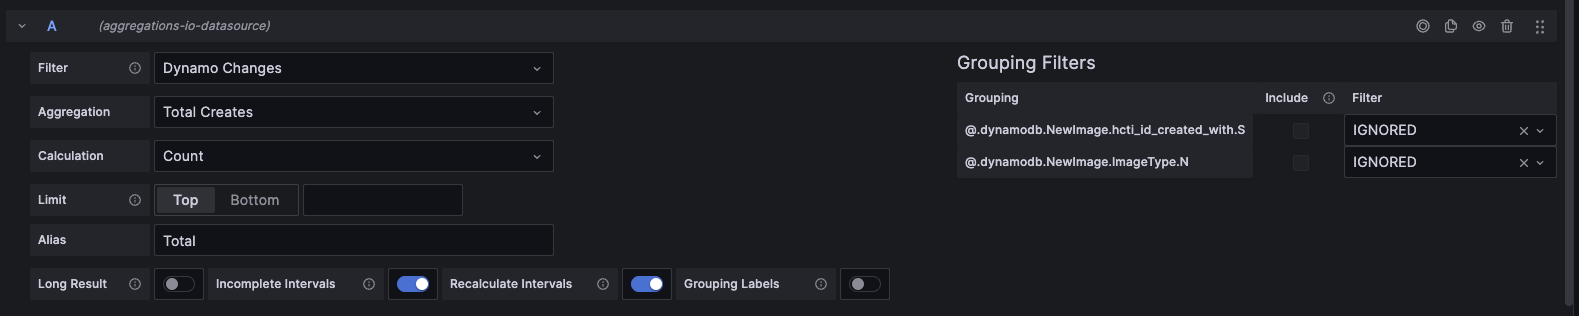
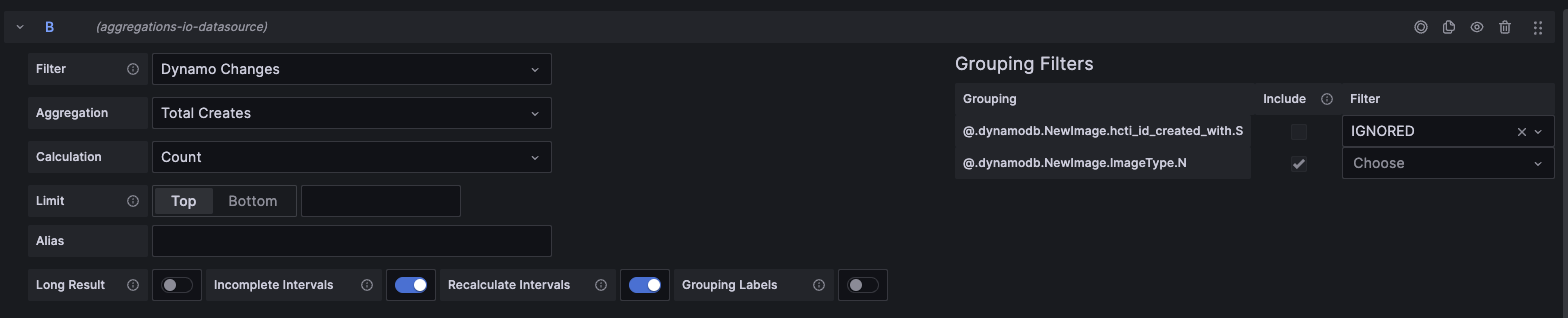
(2) Add a query for Total Stat
Choose the new Total Creates aggregation and set both Grouping Filters to IGNORED to get the totals. Ensure Recalculate Intervals is on, so that the overridden interal takes effect.
#
(3) Add a query for Per-Image-Type Stats
Similarly, the Total Creates aggregation is chosen, but only set the hcti_id_created_with Grouping to IGNORED - since this stat is meant to be per-image-type.
Ensure that Recalculate Intervals is on.
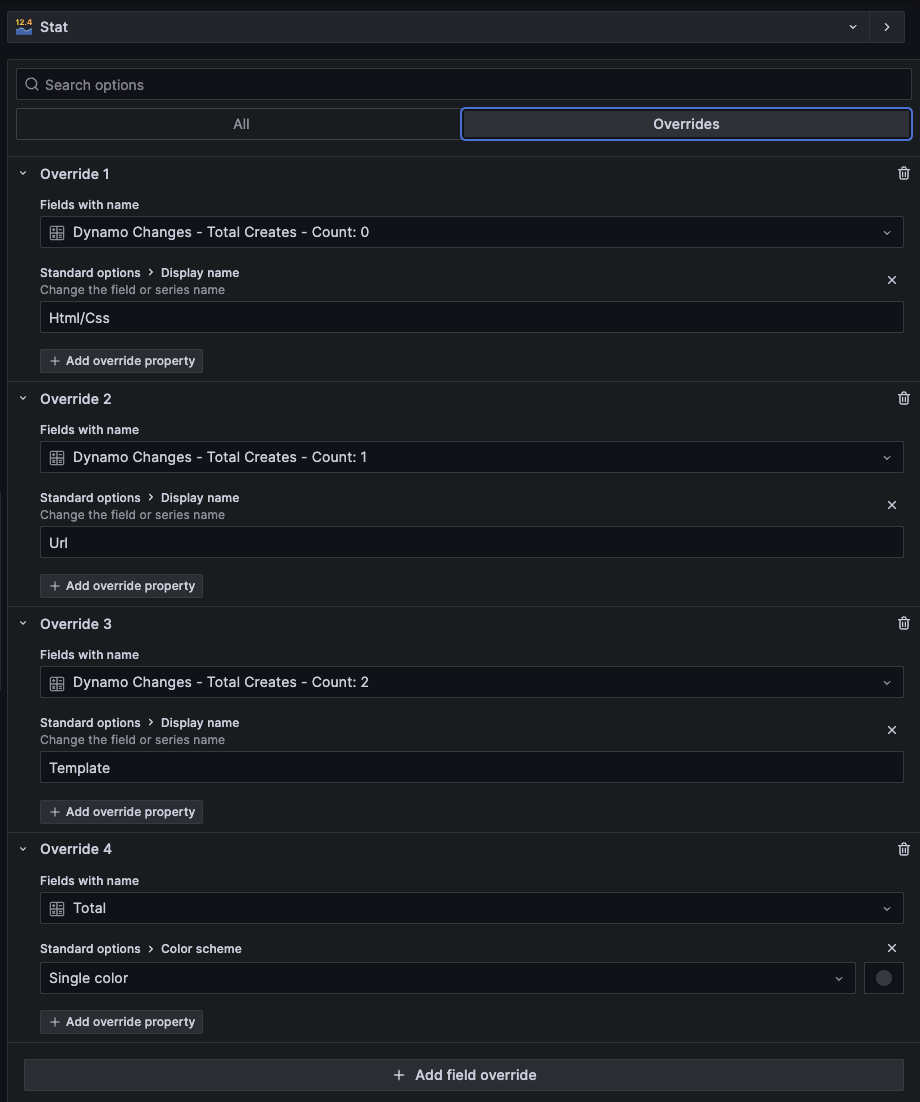
You can further enhance these stat panels with overrides and styling. For example, since the Image Type is an enum, they've overridden the Display Name property for each returned value to correspond to the proper string.
#
Per-User Lists
It's often handy to have an at-a-glance view of which customers have been the most active users of your service. HCTI wants to monitor both the users overall creating the most images, but also those who are creating a lot of larger (externally stored) images -- as this often correlates with abusive behavior.
#
Top Creating HCTI Ids
This table displays the 10 most active image creators in the selected time range. To generate this table:
#
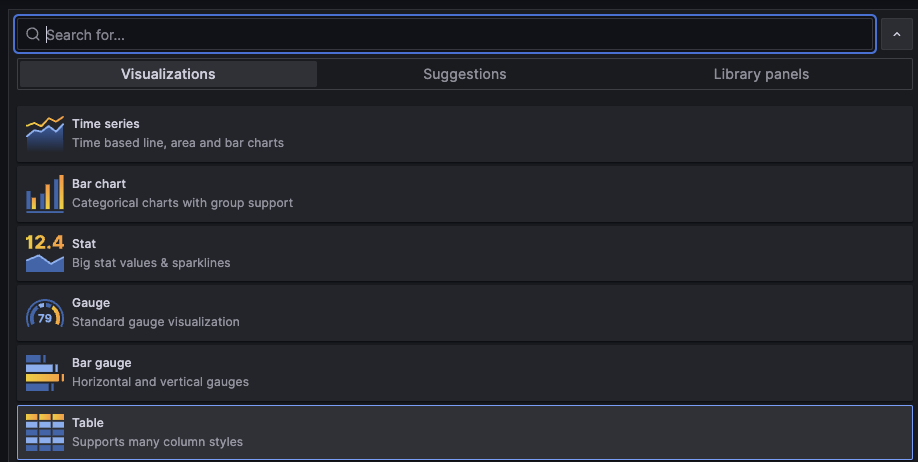
(1) Change the Panel Visualization to "Table"
#
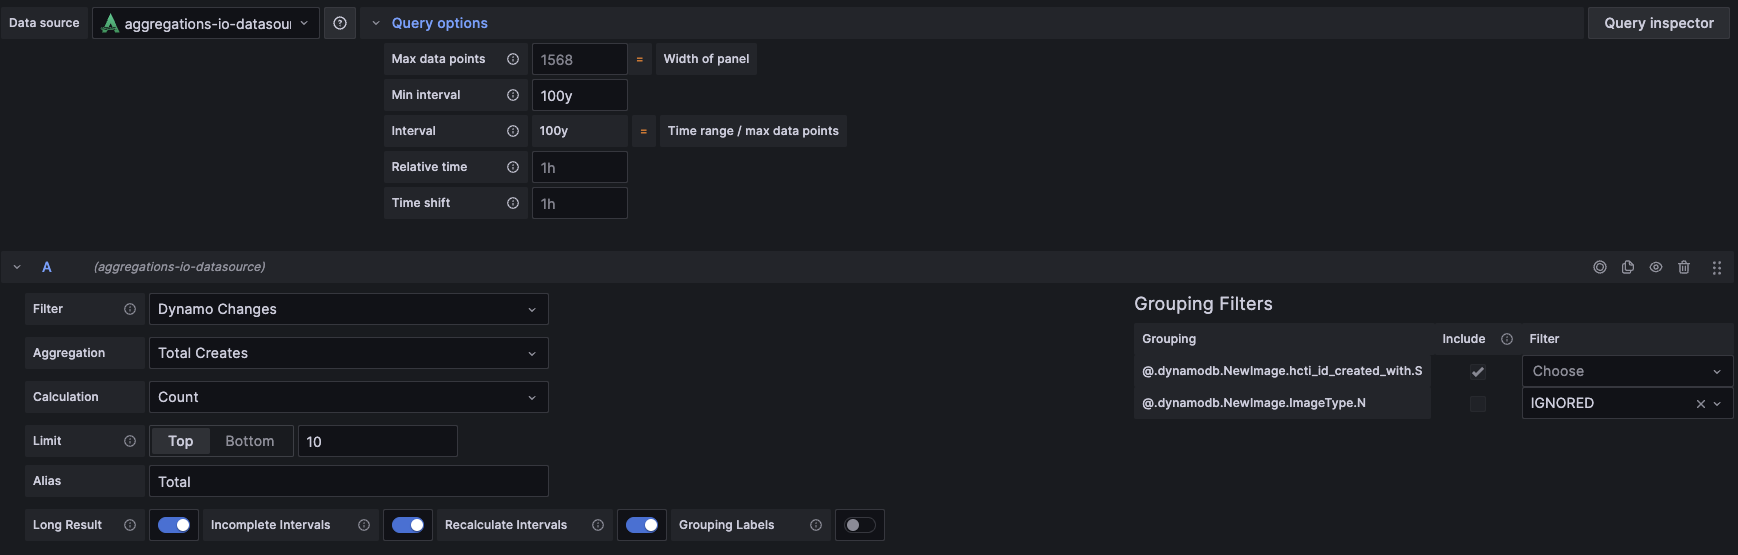
(2) Add your query
- Select the
Dynamo Changesfilter and theTotal Createsaggregation. - Set Limit to
Top 10 - (optionally) Define an alias, which will be the column header in the table.
- Enable the
Long Resultoption, which will optimize the returned data frames for tabular display - Enable
Recalculate Intervalsto ensure you get a rolled up result over the selected timeframe, per-customer. - Enable only the per-customer grouping filter, setting others (in the case of HCTI,
Image TypetoIGNORED) - Set the Query Options
Min Intervalto something large, like100yto ensure an overall rollup.
Your setup should look something like:
The result should look like this:
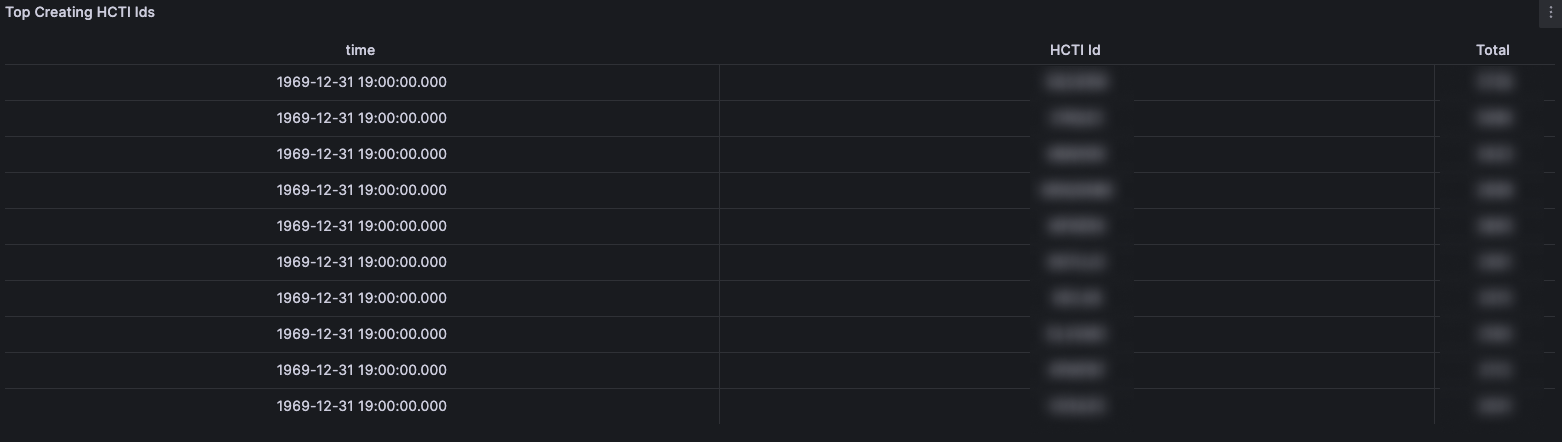
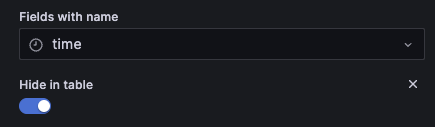
Since the time field isn't really necessary - we can hide that using a field override.
Additionally, you can control the way Grafana sorts the table by using the Sort By transformation. Setting this to reverse by the Total field will ensure you consistently see the top users at the top.
#
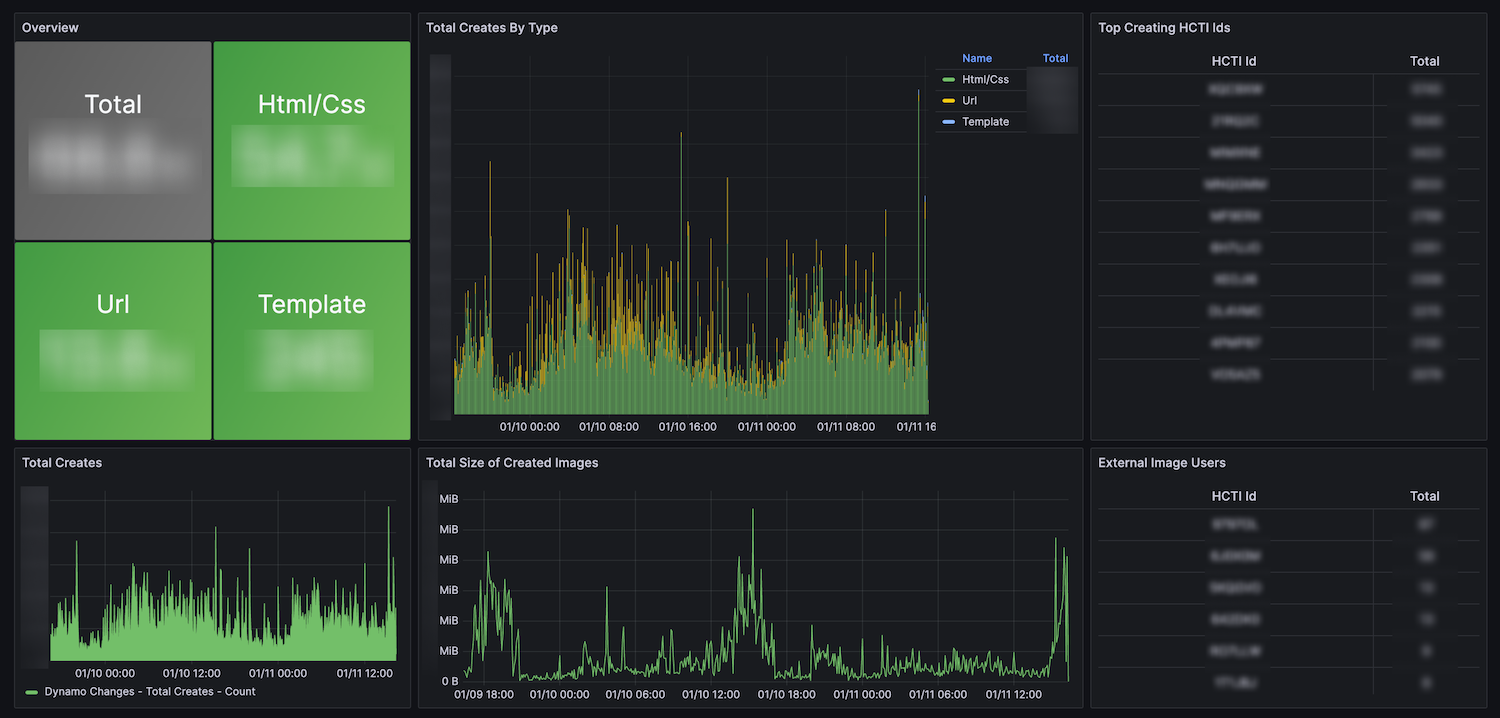
Result
In the end, a small sample of the dashboard may looks like the following, providing HCTI a high level view of recent usage trends, top users and a real-time monitoring starting point.
#
Building the Customer Dashboard
In an upcoming guide we'll dive into how HCTI can utilize this data to power their customer dashboards. Providing near real-time insights and usage tracking back to their customers, using the Aggregations.io Metrics API.