#
Grafana
The Aggregations.io Grafana Plugin is the easiest and best way to activate your analytics data in real time.
#
Installation
To install for Grafana Cloud, simply navigate to the Plugin page and choose Get Plugin.
If you're not using Grafana Cloud, you can utilize the Plugin Catalog to find and install the Aggregations.io Grafana Plugin.
#
Configuration
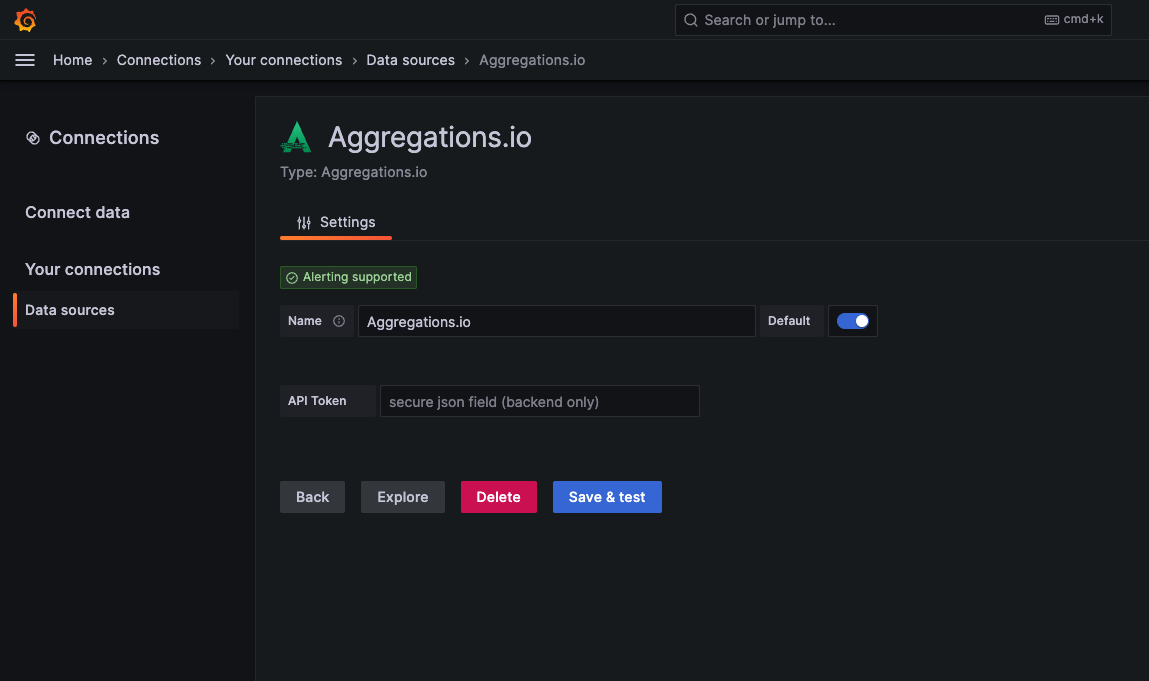
After installing the plugin, configuration is simple.
- Create an
org-wideAPI Key - Copy the key and paste it into the
API Tokenfield in the Data Source Configuration screen.
#
Panel Options
#
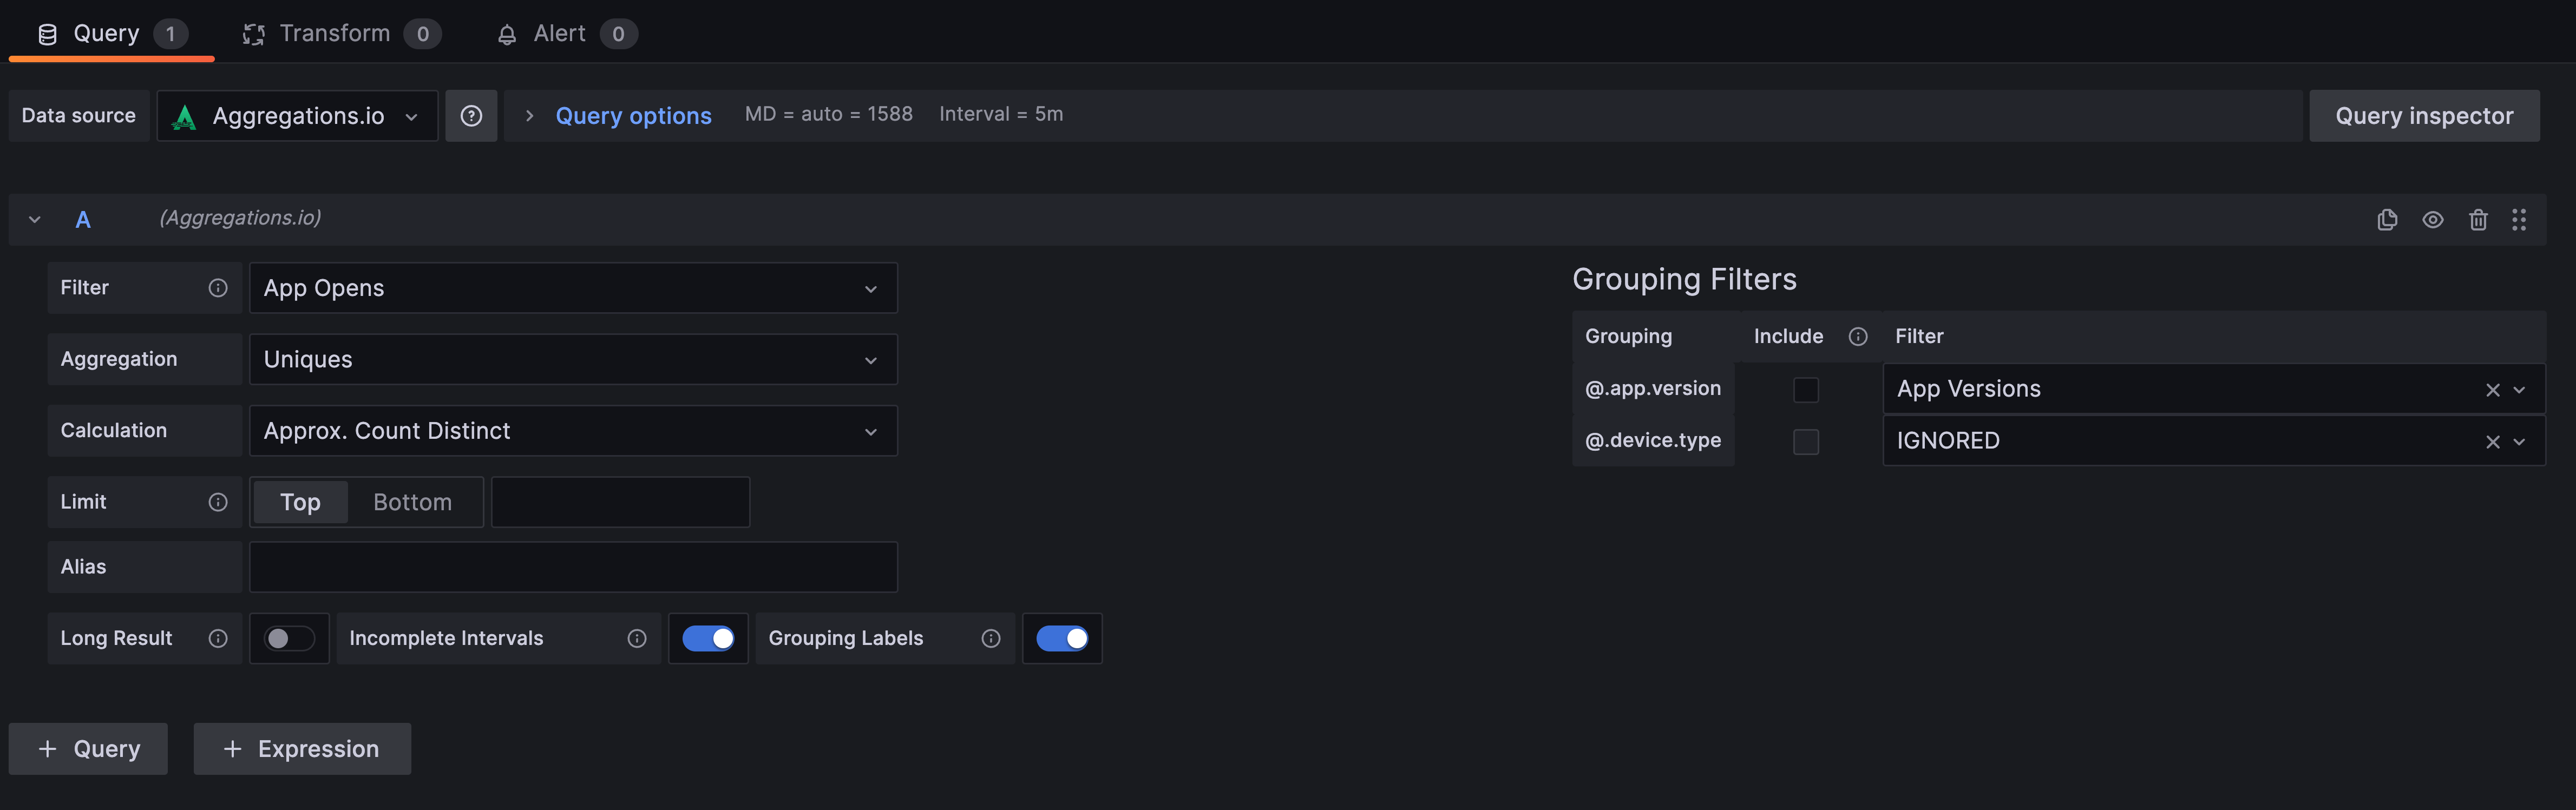
Filter, Aggregation, Calculation
Choose the relevant item you'd like to visualize. These dropdowns will cascade as you change your selections.
#
Limit
For grouped metrics, it may be handy to exclude noisy / irrelevant data points. You can choose whether to keep the TOP or BOTTOM (n) groupings per-interval.
#
Alias
This is useful if you're visualizing multiple aggregations. The default behavior is to differentiate series based on the selected filter, aggregation & calculation.
#
Example
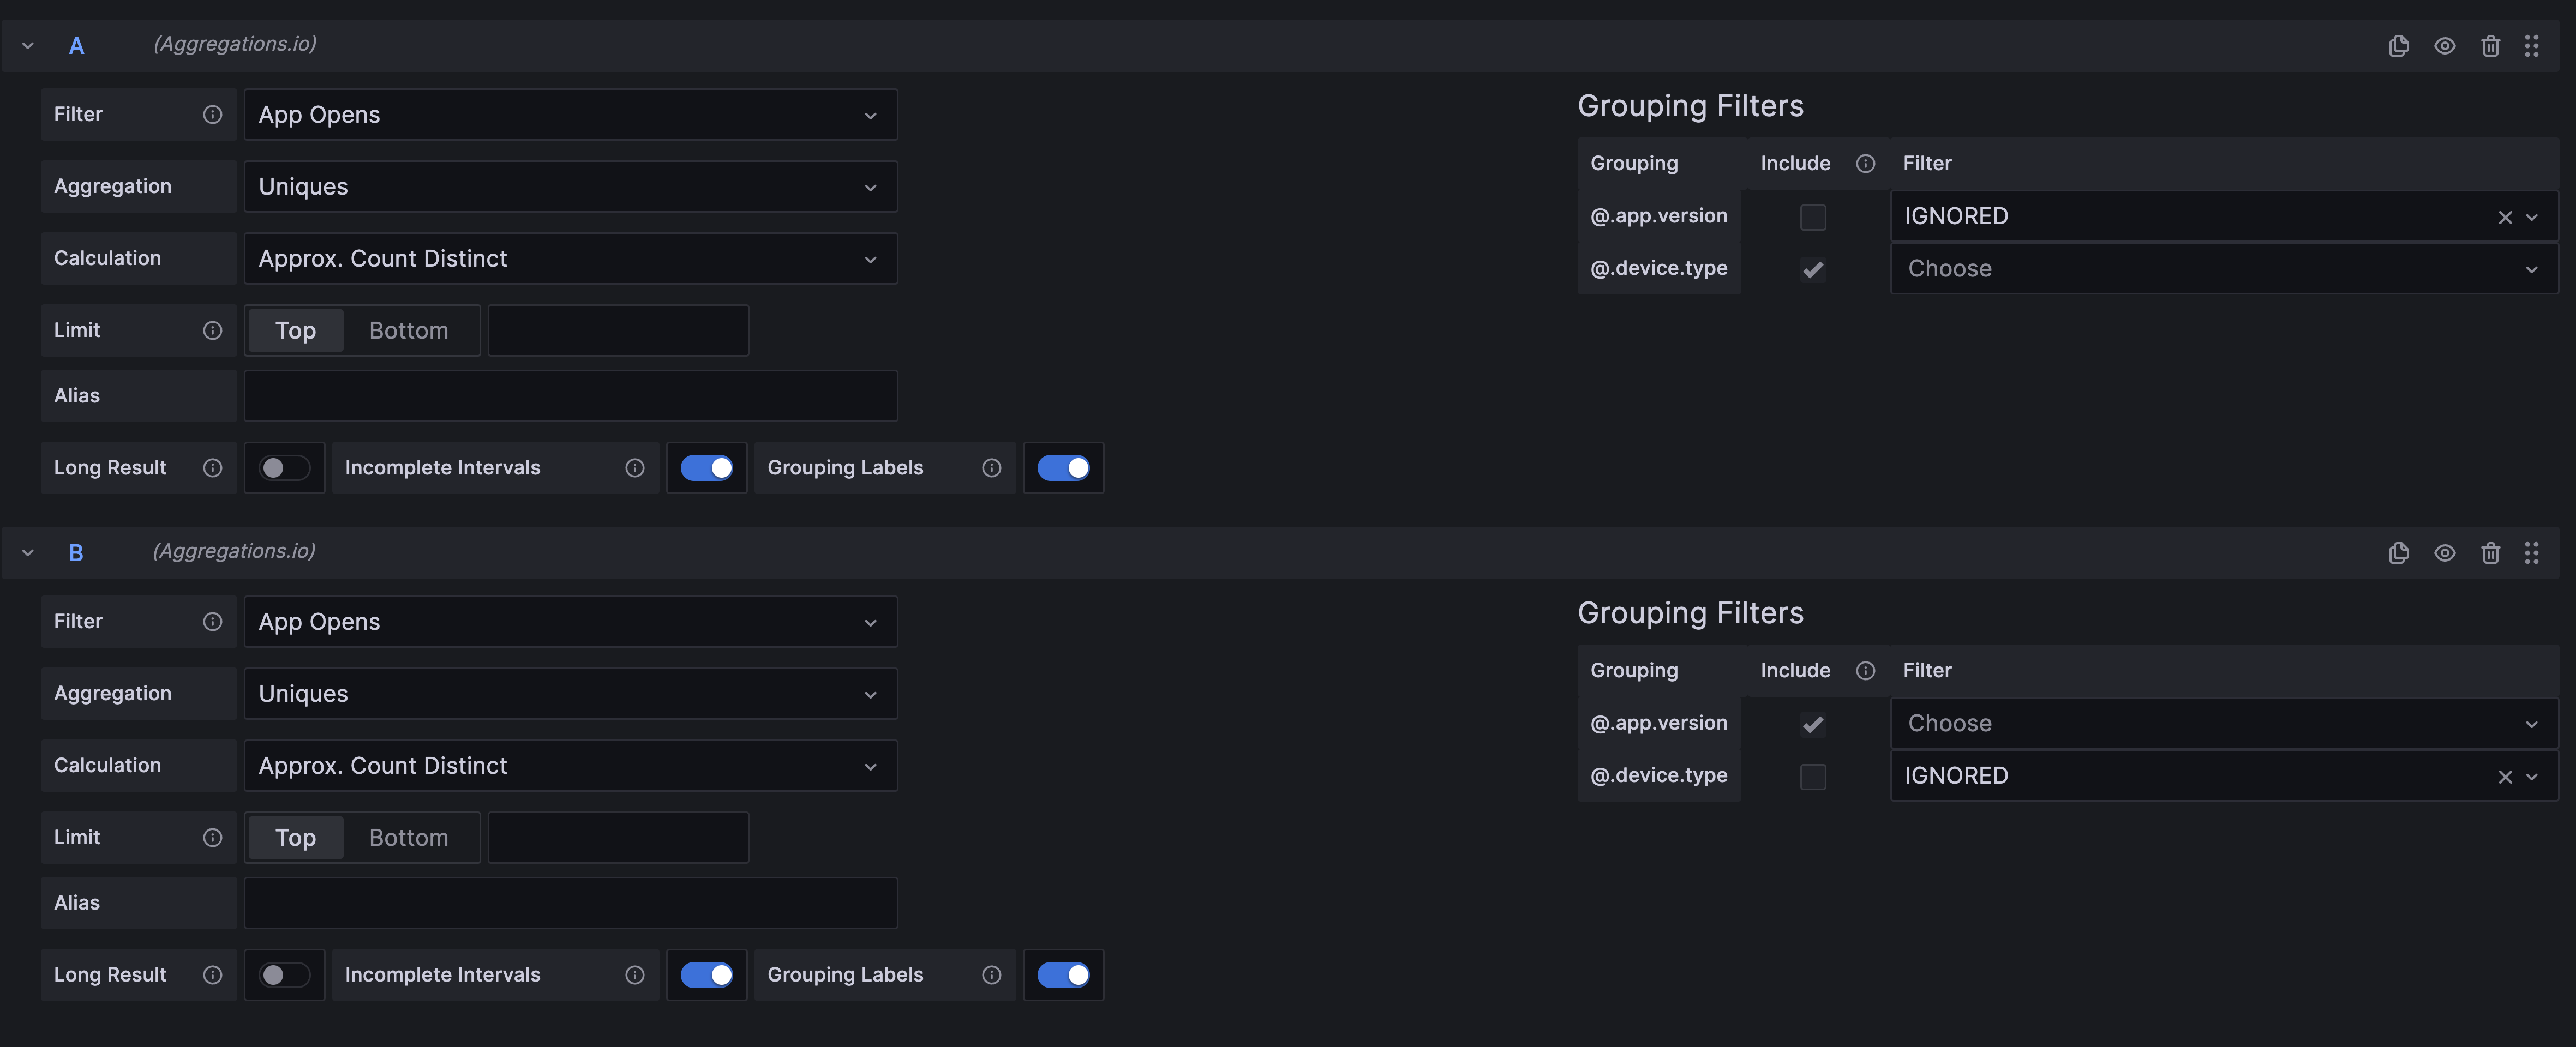
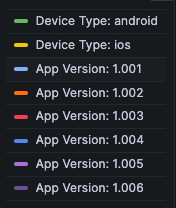
In the example below, you can see the same query set up to display unique users, by App Version and by Device Type (without all the combinations). It results in an ugly legend.
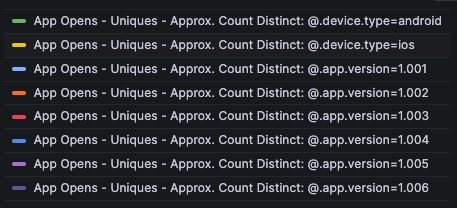
By applying an alias, the legend is much clearer and easy to use.
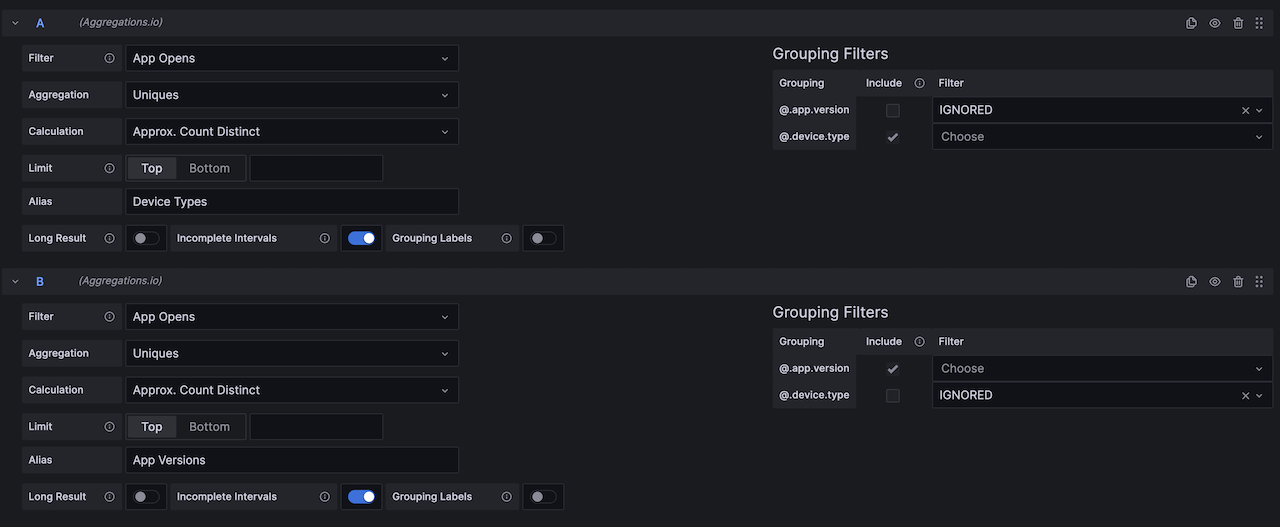
NOTE: disabling the grouping labels option is useful is this scenario as well, because we are essentially aliasing our series based on their groupings.
#
Long Result
Enabling Long Result returns the data frames in a "tall" fashion, used for tabular display modes.
#
Incomplete Intervals
Disabling Incomplete Intervals will return all results, including those that may be part of an incomplete interval. For example, if it is 12:02 and you are looking at a filter that is set to an Every 5 Minutes interval - with this setting disabled, your most recent data point will be for 11:55, but with it enabled, you may have datapoints with a 12:00 interval.
NOTE: When enabling this setting, there is a 10s buffer added to make best-effort that data ingested has indeed all been aggregated for the most recent interval.
#
Recalculate Intervals
Enabling Recalculate Intervals will utilize the Query Options within Grafana to define the returned interval of data points. You can let Grafana automatically calculate the interval for you based on the visible data points and time range, or set Max Data Points and Min Interval manually.
This is helpful when you want to have performant dashboards over long time horizons. For example, a filter defined as Every 5 Minutes over 1 year will have over 100,000 data points (ungrouped), but based on the width of your panel, it may only show 1500. Grafana calculates a more appropriate interval of ~6h and uses that. You can read more about the query options in the Grafana Docs.
Note: Aggregations.io only reaggregates to larger intervals (hourly can become daily, but not minutely) - if Grafana's calculated interval is lower than the interval defined on the filter, the filter's original interval will be used.
This can also be a handy option for rolling up data over the entire time period. Setting the min interval to something large like 50y will (most likely) capture all your relevant data. You can then utilize a non-timeseries panel type to display your results. This will yield quicker and more flexible dashboards than returning all the data points and letting Grafana do the aggregations client-side.
#
Grouping Labels
This setting allows you to show or hide the grouping labels on the returned series. If your groupings are self-evident (like @.app.version and @.device.type) this can be handy to disable for better displaying results.
#
Grouping Filters
This section works in tandem with variable setup described below.
If your filter has groupings defined, you can choose how to work with them here.
For each grouping, you can decide whether to include it as a series in the chart, and how/ if you want to filter the values.
You can do 1 of 3 things from the Filter column:
- Do nothing, the grouping will be included in full. You are unable to change the
Includestate with this option, it must be included. - Set the value to IGNORED to ignore that grouping, and roll up its calculations to other groupings. You are unable to change the
Includestate with this option, it cannot be included. - Link the grouping to a defined variable, so that the dashboard has control of how it behaves. You CAN change the
Includeoption when defining explicit filters. This is especially valuable when you're using Constant filters and don't need to have extra space in the legend taken up repeatedly.
#
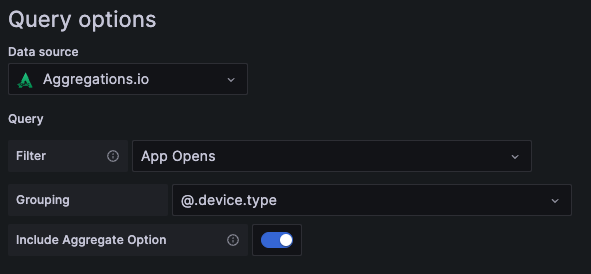
Variable Support
Adding a variable based on your Aggregations.io groupings is easy, navigate to the Add Variables screen, choose Query as the variable type and Aggregations.io as your data source.
- You'll choose a
FilterandGroupingthat you want to have available. - You can choose to
Include Aggregate Optionwhich will add an$__aggentry to your dropdown. - Multi-value variables are fully supported, but if you choose
$__agg, other options will be ignored. Custom all valueshould be left blank.
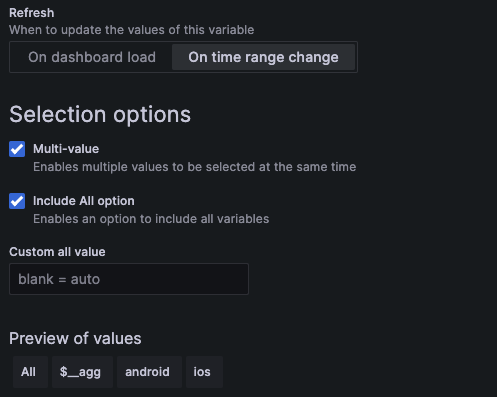
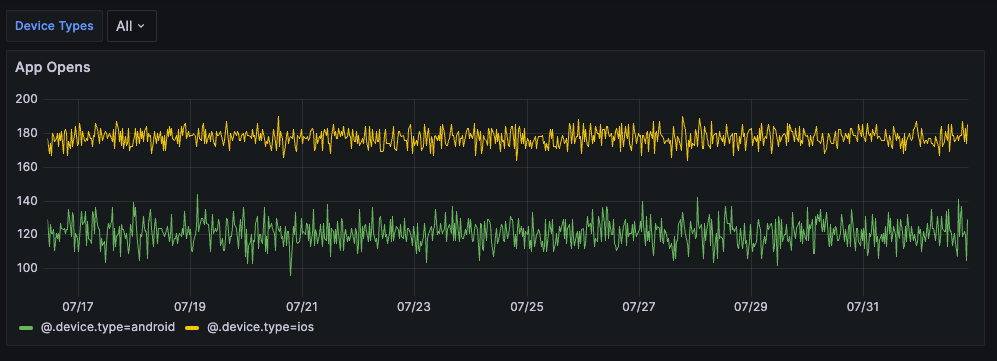
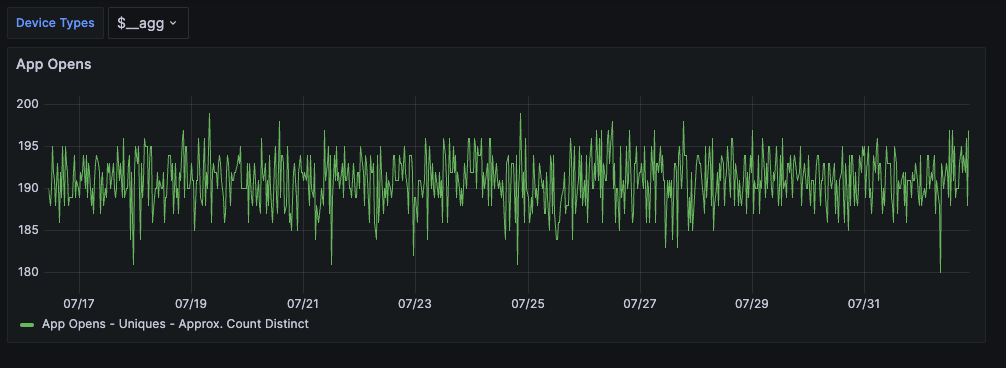
In the example below, we have ficticious users who use both iOS and Android, so the aggregate on an Approx Dist. Count is less than the simple sum of the groupings.
All Selected
$__agg Selected
See the Grafana docs for best practices and general guidance on variable use.
#
FAQs
Yes!
Grafana utilizes the Metrics API and conforms to its same rate limits. Note that each call for variable values applies to this rate limit as well.
Yes again! The grafana plugin is open source and the code can be found on GitHub. You may notice some differences from the documented APIs - there are some optimizations made specifically for Grafana there.