#
Measuring Concurrency Using Heartbeat Events
Tracking concurrent users (CCU) of your product, whether it be a game, mobile app or an online service is both a valuable metric and often times a leading indicator for other key metrics like revenue and time spent. Measuring concurrency can be done in many ways, each with their own pros and cons. This post will cover what we've found to be the best way to track CCU, Heartbeats, and how you can use Aggregations.io to monitor and analyze your product's CCU.
#
What is a Heartbeat Event?
Simply put, a heartbeat event is an event your product emits on a regular cadence with information about a particular active user's usage. It is usually implemented as a client side event.
For the purposes of this guide, we're going to assume a video game emitting a minutely heartbeat event.
Let's imagine a theoretical event that looks like this:
{
    "eventName": "heartbeat",
    "environment": "production",
    "device": {
        "platform": "xbox",
        "model": "xbox_one"
    },
    "version": "12.0.1",
    "context": "inGame",
    "gameMode": "ffa",
    "gameId": "ffa-4-abc",
    "timestamp": "2023-07-15T01:01:22",
    "serverRegion": "NAE",
    "userId": "abc123",
    "partySize": 1,
    "gameMatchId": "xxxx-aaaazzzz-12312312321",
    "gameDurationS": 30,
    "pointsSLHB": 40
}
It may be very tempting to attempt to make your heartbeats stateful, adding things like xSinceLastHeartbeat - this can be extraordinarily useful, but also may add unnecessary complexity. In the example above, we've added one such property pointsSLHB (points since last heartbeat).
#
How to measure
Now, it may be easy enough to just say, let's count the number of heartbeats we receive every minute, boom concurrency!
Not so fast... clients are imperfect. Maybe there's a bug. Maybe it's set to send not only every minute, but upon contextual changes as well (as to not miss any particular instances of user <> context experiences).
The best way to measure CCU is to approximate the number of distinct users over a slightly wider range. Since our heartbeat event is supposed to fire every minute, we'll utilize a 2 minute CCU measurement.
#
An example:
Our game sends a heartbeat every minute, but also when a player enters into a new game or switches screens in the frontend navigation. This will allow us to analyze concurrency and behavior, even if a user spends less than a full minute inside an experience. So:
As you can see, we're seeing many more heartbeat events that keep the context up-to-date. Your usecase may not warrant updating context, as you are probably okay waiting until the next regularly scheduled heartbeat. But we're looking at the most extreme case 😄.
#
Setting up your CCU Aggregations
Aggregations.io lets you work with your events, exactly as you send them - no need to think about pre-aggregated states being rolled up across different hosts or running into cardinality pain. You've got your heartbeat event. You want to (approximately) count the distinct userIds every 2 minutes
#
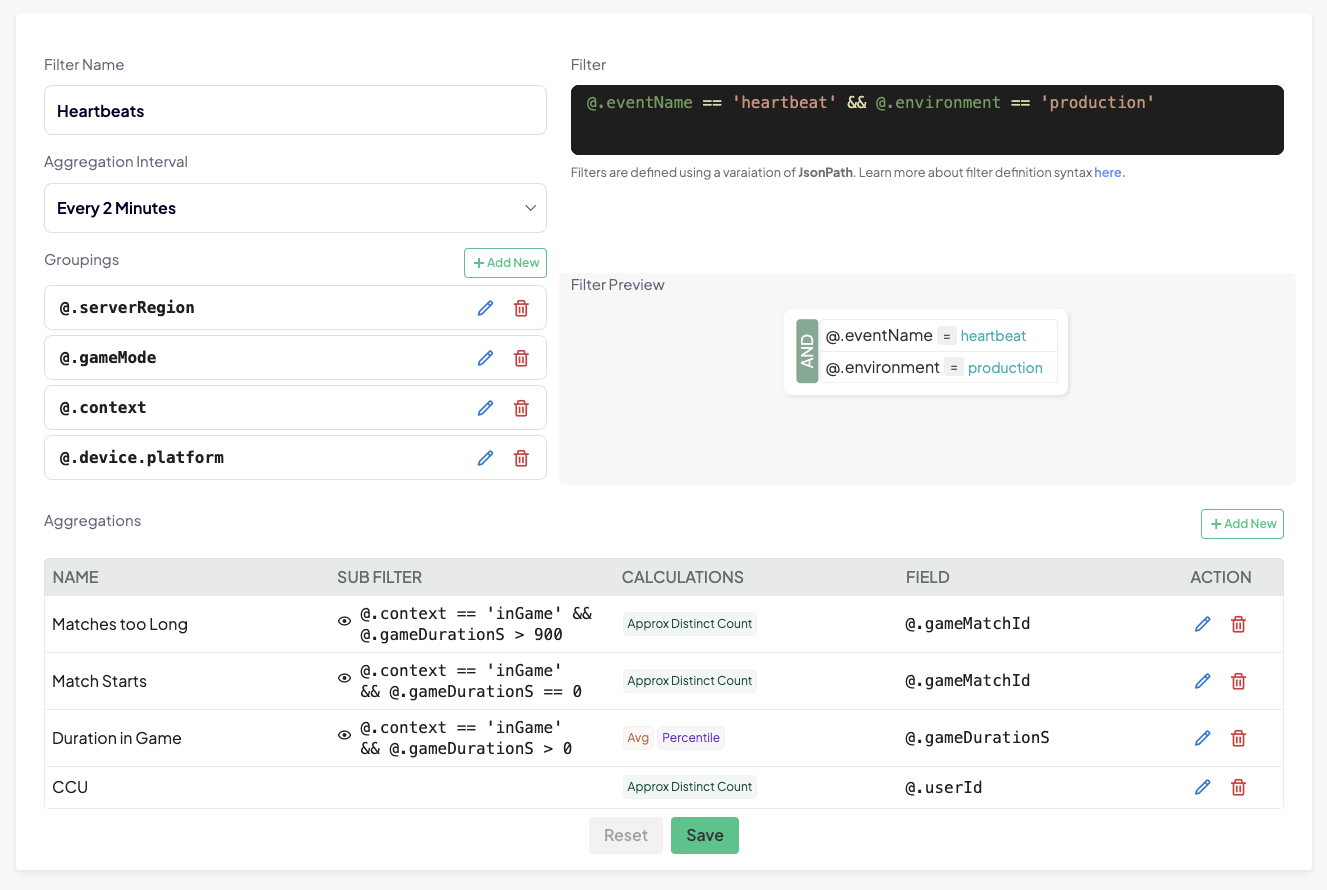
Set up your filter
This filter will be pretty simple. We want to look at all the heartbeats, and ensure we're only checking production data.
@.eventName == 'heartbeat' && @.environment == 'production'
#
Aggregation interval
As mentioned above, since we expect there to be small timing bugs and the potential for devices to get behind, etc... We're going to set our interval to Every 2 Minutes
#
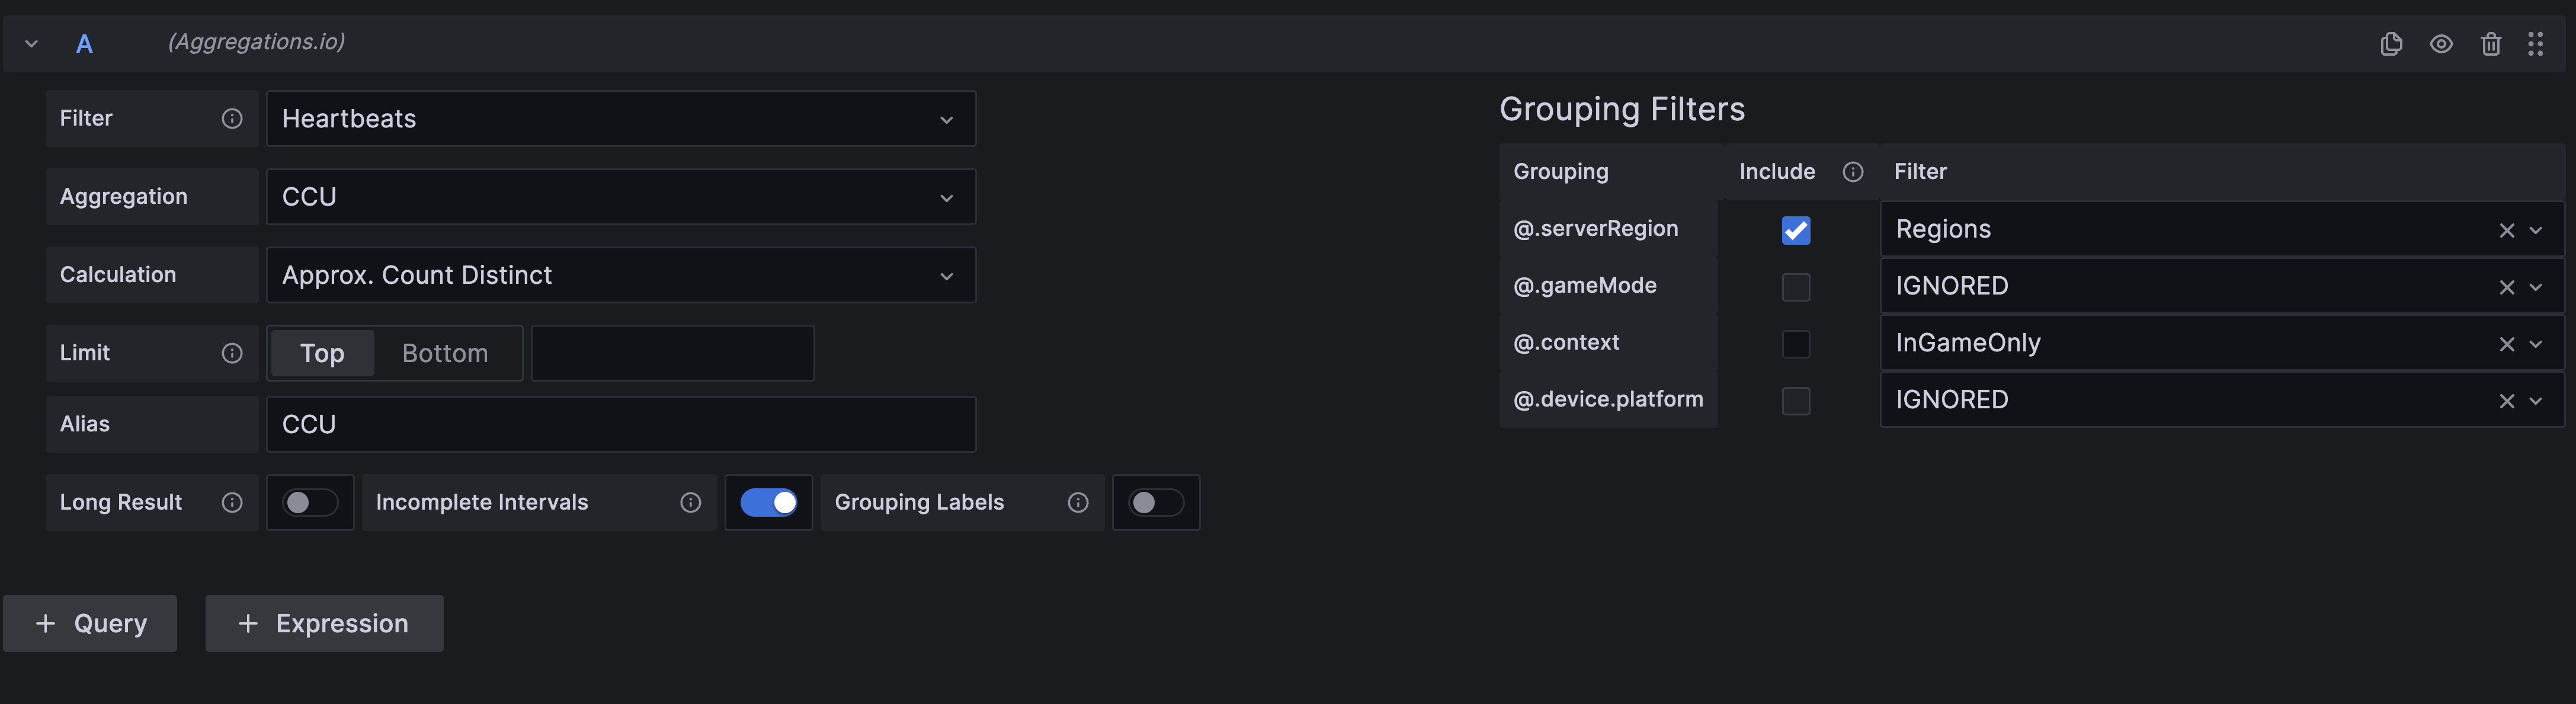
Choose your groupings
This is where the magic really starts to happen, we're sending a lot of valuable contextual data in our heartbeat event, so let's make use of it.
We're going to add the following groupings:
You might be asking about why more detailed fields like @.device.model and @.gameId aren't being included for groupings. Well - they're pretty specific, and may make more sense to include as separate dedicated filters/aggregations. Since these CCU analyses are going to be critically important for our imaginary game's monitoring - we want to keep them efficient.
#
Set up the Aggregations
We know the first, and most important aggregation will be Approx Distinct Count on @.userId
But there's other valuable opportunities with this data:
#
Grafana Dashboards
So we've aggregated all this super useful data! Now we need to put it to work. We're going to utilize the Aggregations.io Grafana Plugin to create a dashboard for monitoring our game's CCU in real time.
We've sent in a few million fake data points over a simulated hour with randomness for:
- User Device Platform
- Whether or not users progress from
mainMenutoinGame- Which
gameMode? - How long do they survive?
- Which
serverRegion?
- Which
Our aim here will be to establish an accessible and simple observability dashboard for looking at CCU across our various groupings, but also with the ability to dig in by various factors, firstly Platform.
#
Variables
We're going to set up 3 variables to our dashboard. The variables will offer us simplicity in configuring our panels, and also add interactivity to make them more powerful and allow deeper exploration of the data.
#
InGameOnly
Simple text variable for restricting certain panels to filter only inGame
#
Regions
Variable enabling us to filter any region-related charts to one or many regions.
#
Devices
Variable enabling us to filter any device-related charts to one or many devices. We'll also use this one to demonstrate the power of repeated panels.
If you're new to Grafana, variables are found in the dashboard-level settings menu (the ⚙️). Read more about Grafana Variables here.
#
High Level CCU
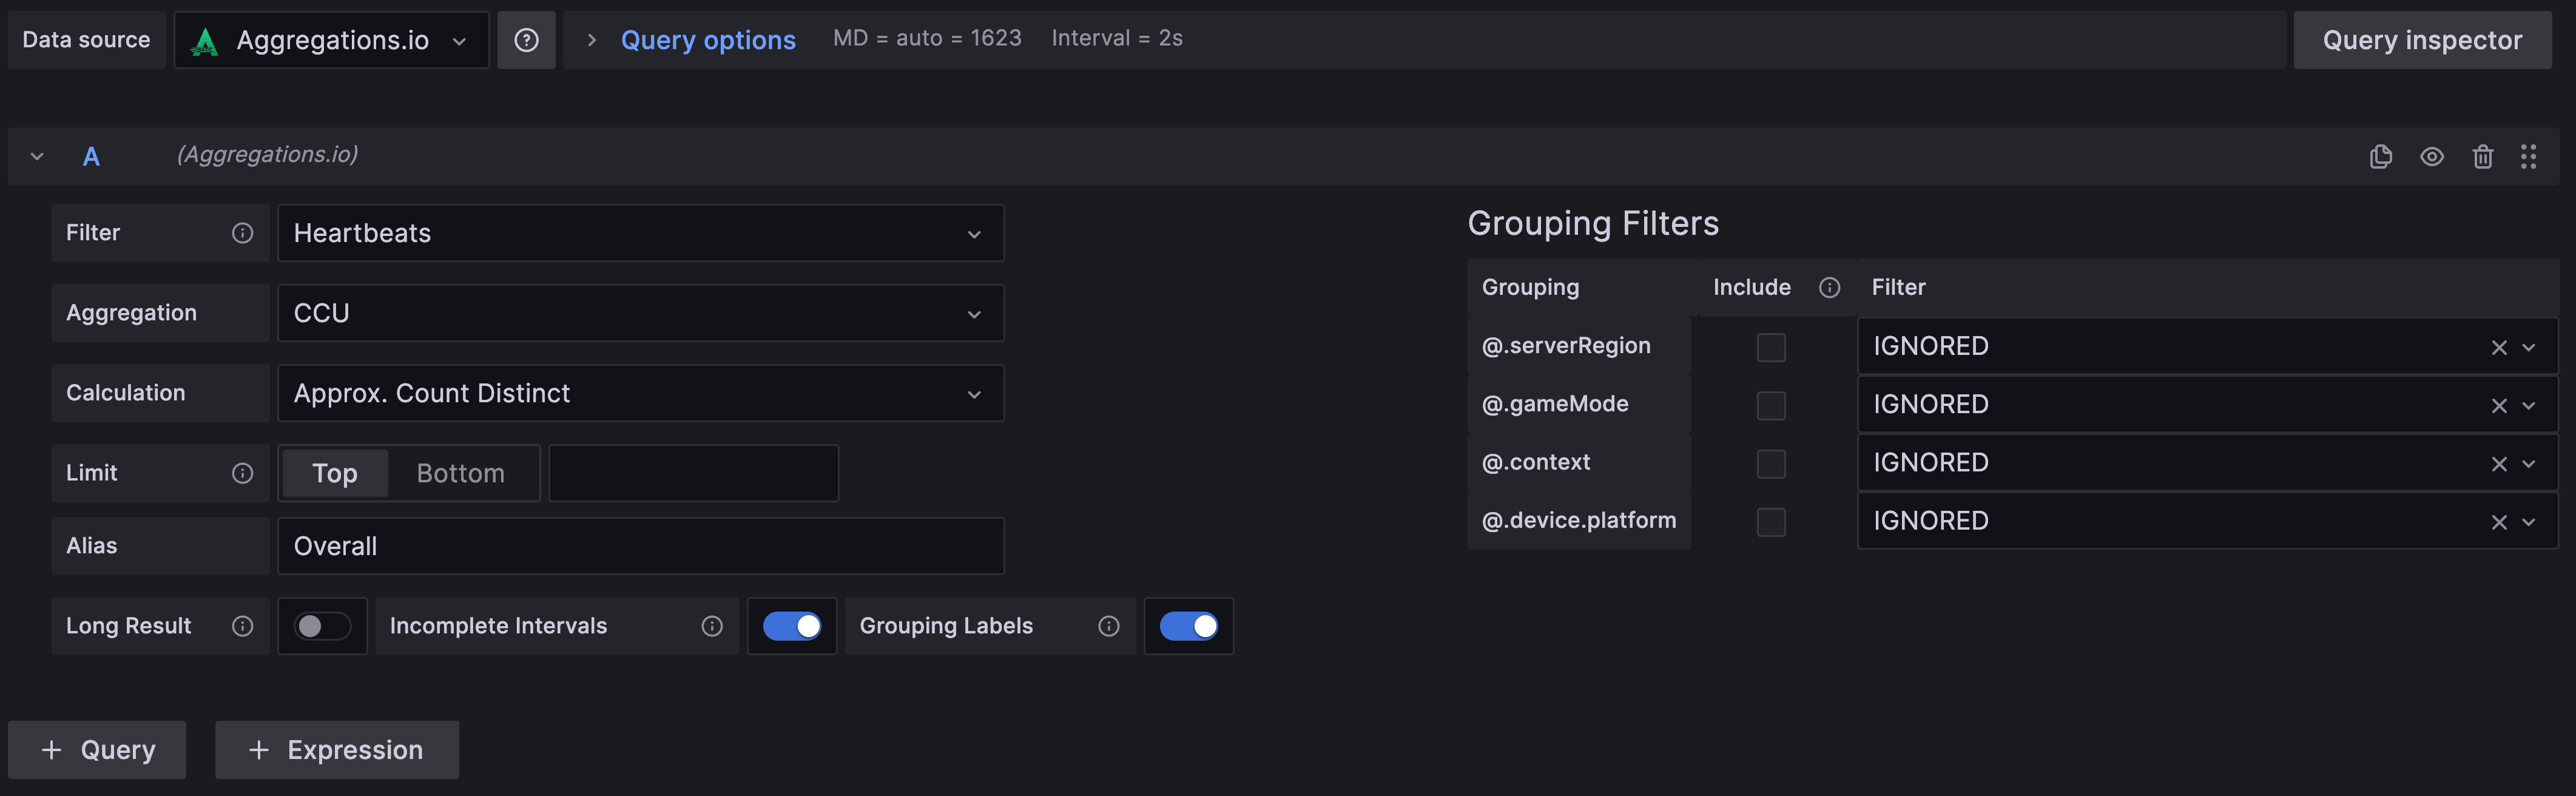
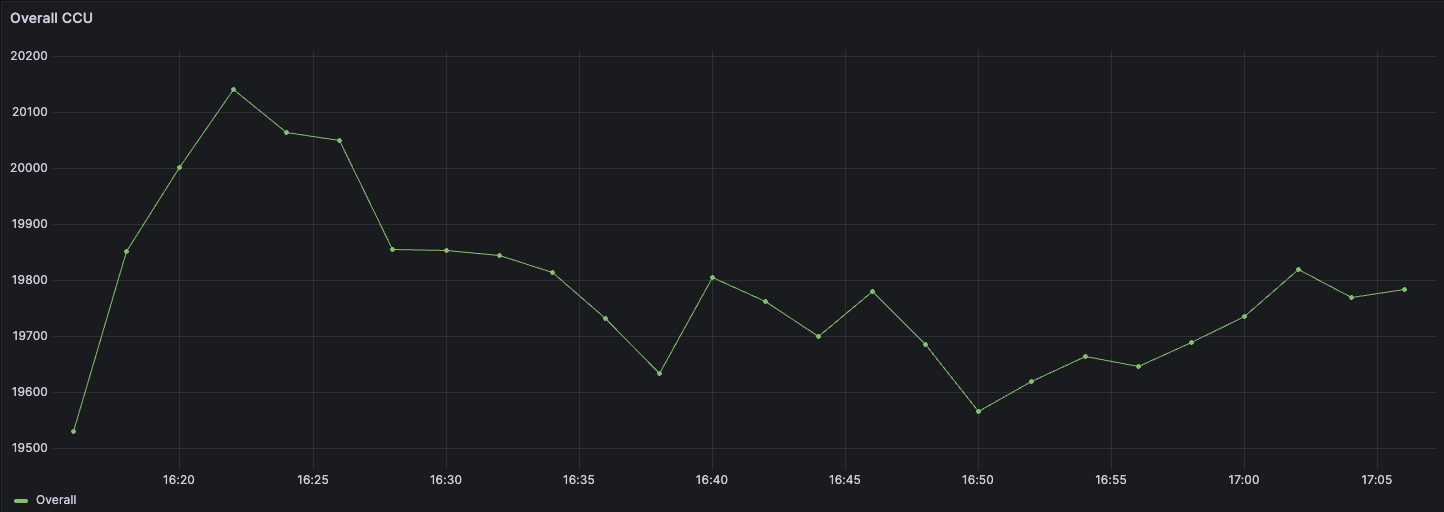
We start by adding a panel for overall CCU, selecting our newly created Heartbeats filter and the CCU aggregation. Since we want this first graph to be high level, we set our groupings to IGNORED.
#
CCU Breakdowns
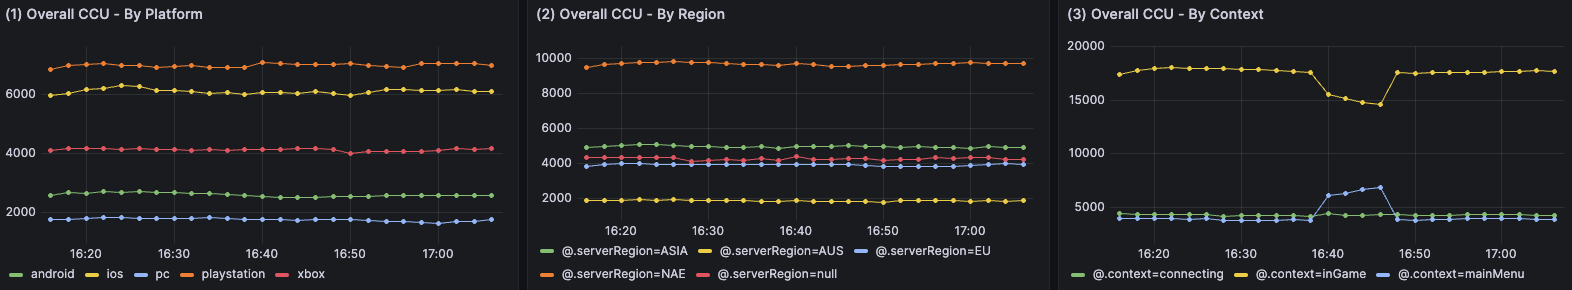
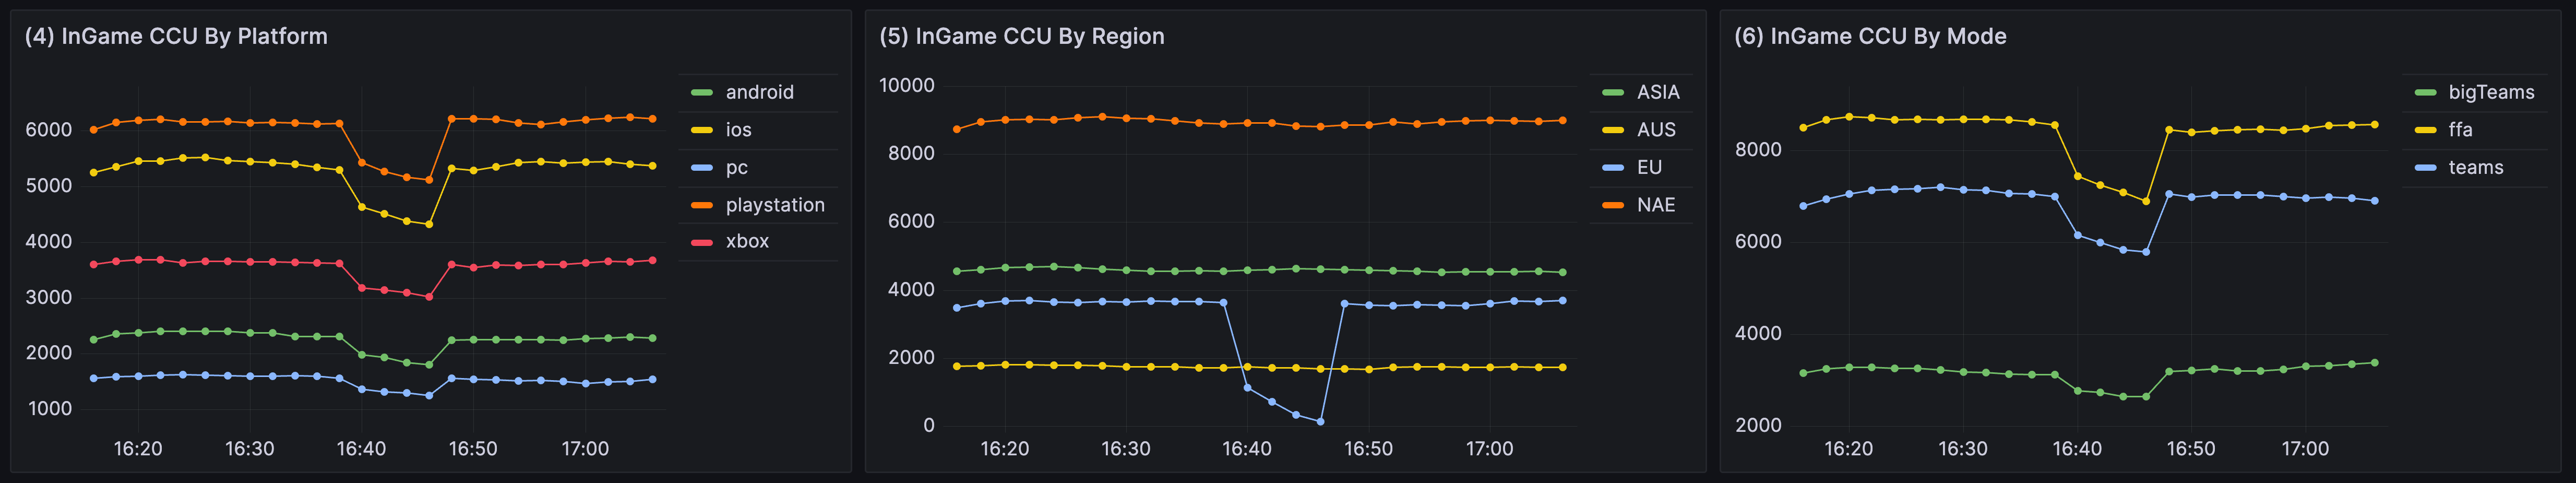
We're setting up breakdowns for high level monitoring of CCU by (1) Device Platform, (2) Region, (3) Context. We also want to monitor in-game CCU by (4) Device Platform, (5) Region (6) Game Mode.
#
1,2,3
We set up our Overall CCU graphs for Platform, Region & Context just like the top-level CCU Graph, except this time we don't set all the Grouping Filters to IGNORED. For Platform, we select our Devices variable in the dropdown for @.device.platform to link them up. We do the same for Regions and for (3) - we don't need interactivity there so we just don't set the @.context value to anything (meaning it will always be grouped).
Our end result looks like this:
#
4,5,6
We can duplicate our charts from above and adjust them slightly utilizing our InGameOnly constant variable. By assigning this to the @.context grouping, we ensure we get the population who are in-game. Additionally, we can keep our legend clean and simple by unchecking the Include checkbox next to @.context, since we know it will only be a single value.
We create these for our 3 different groupings and the result should be similar to the below:
#
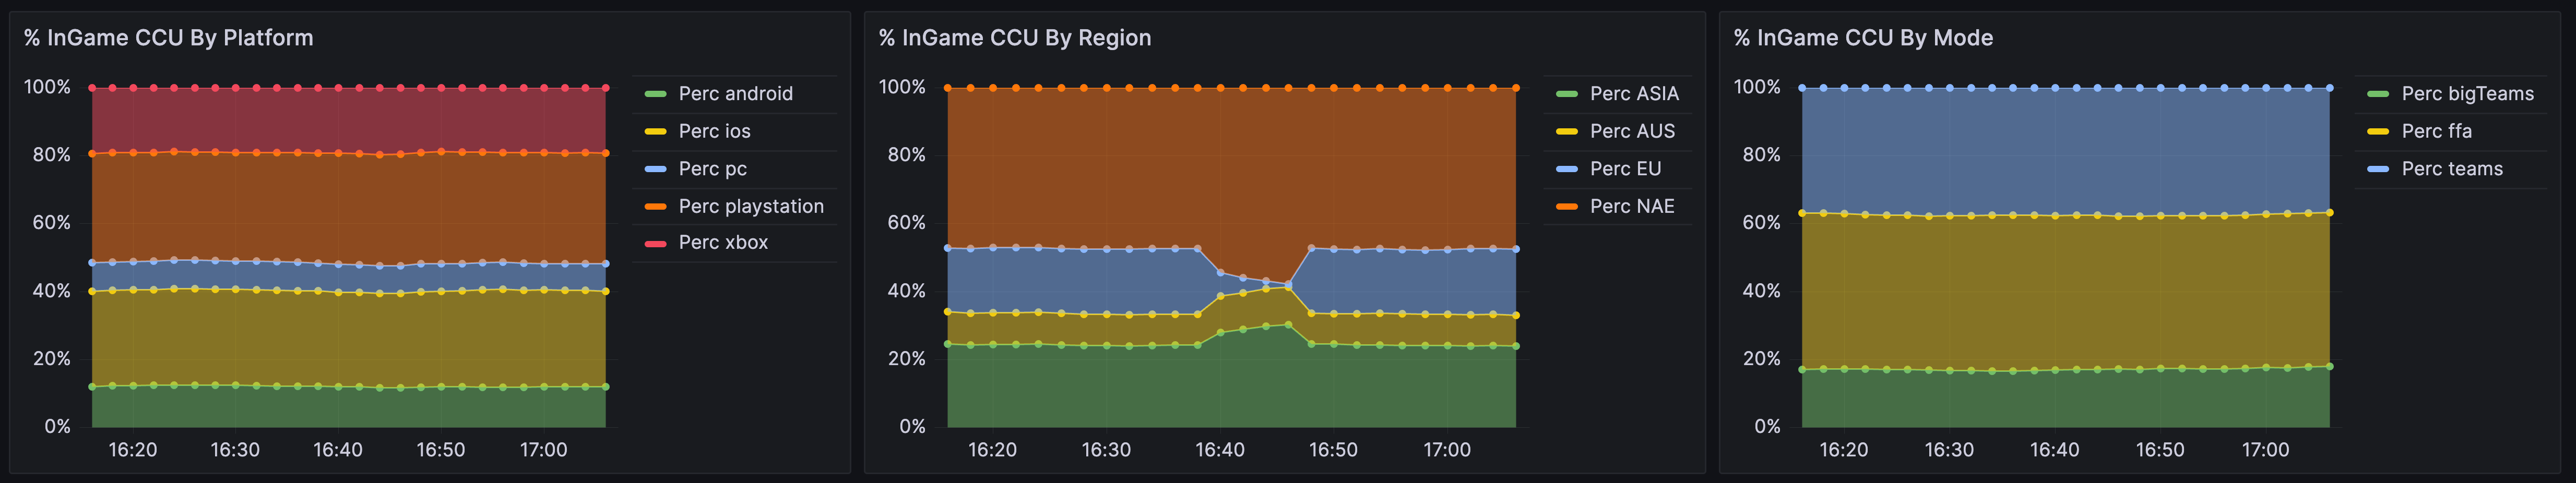
Bonus points: Percentages
It's useful to not only have the raw number of users on any given device/platform/mode - but a quick glance at the percentage breakdown is handy as well. To do this, we can take advantage of grafana expressions and tranformations.
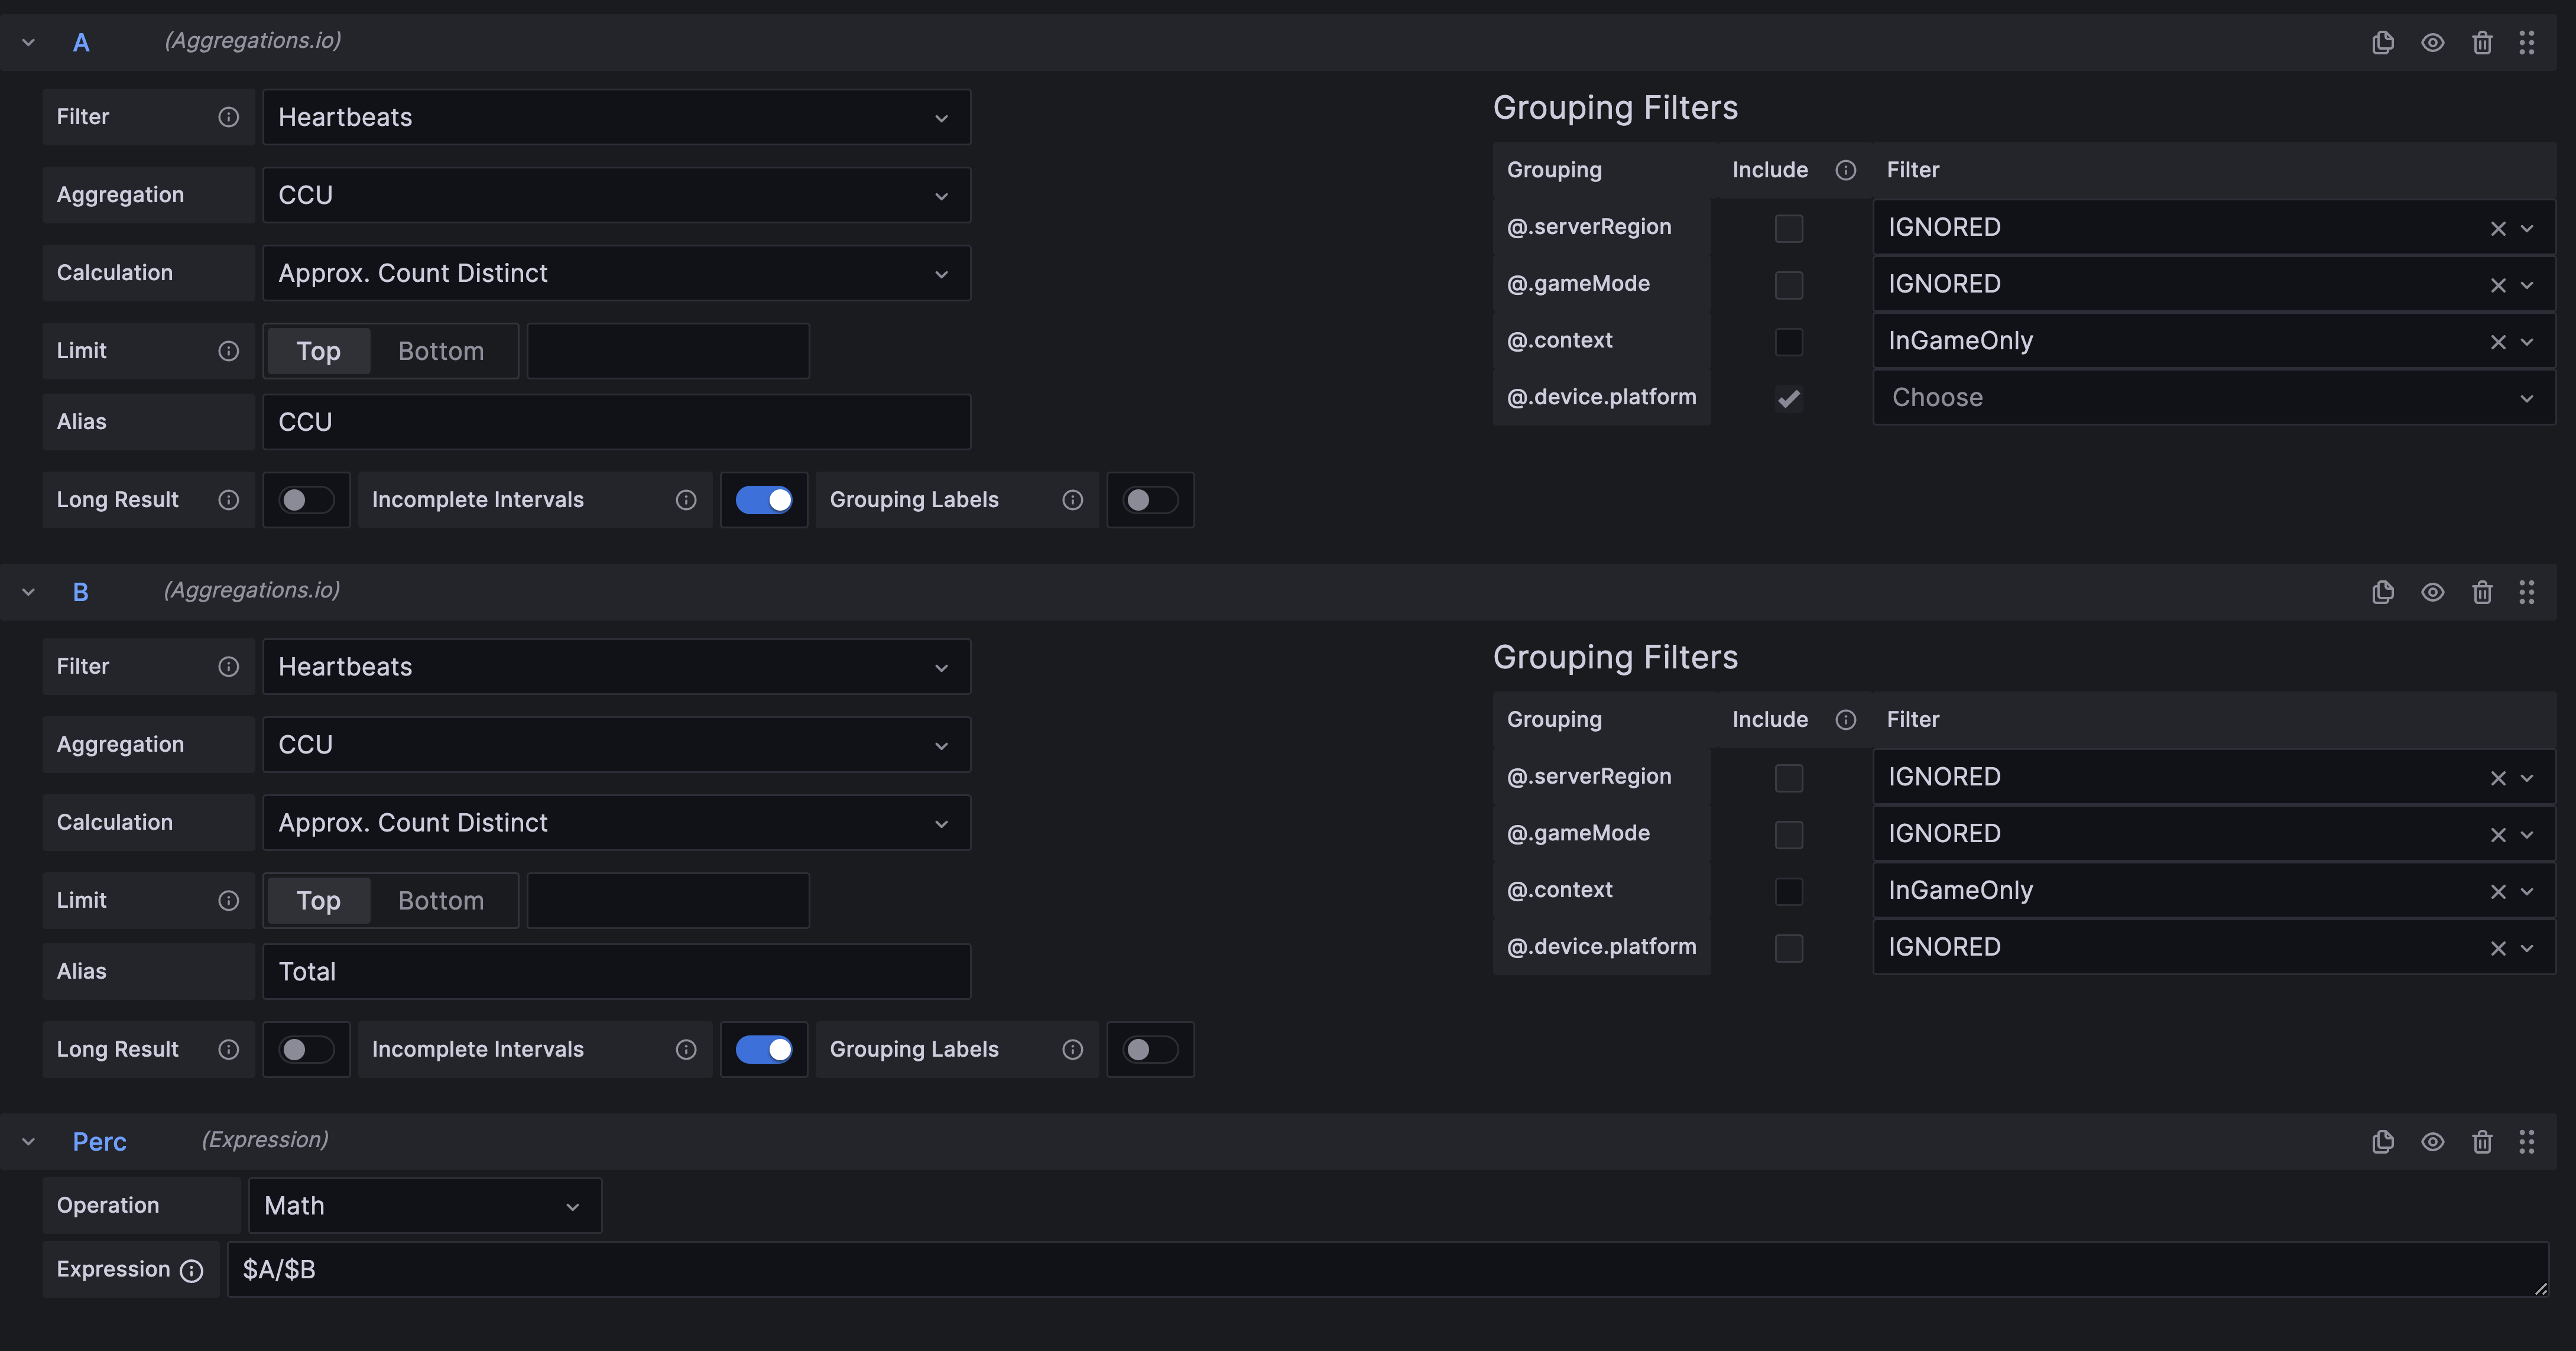
We want to achieve ios / total, android / total, xbox / total etc.
First, you'll want to add a second Query, basically the same as Overall CCU mentioned above.
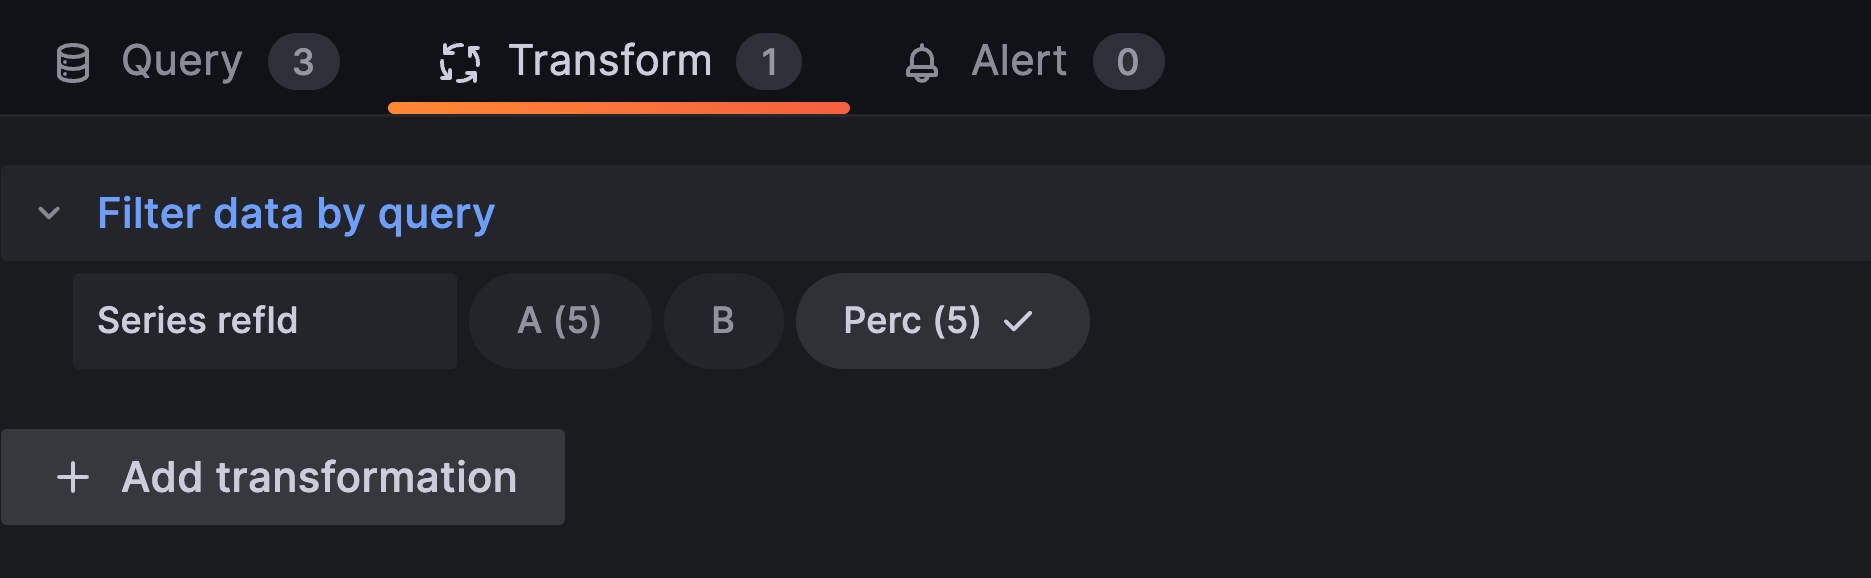
Next we add a third item, but this time we want to choose + Expression. We want to do Math! $A / $B (assuming your per-device query is A and the total query is B). I named this third item Perc to keep my legend sensible.
You'll notice now you have some extra series in your chart, to clean this up we utilize the Grafana Transformation to Filter data by Query and select only our Perc item.
Finally, we make it look a bit more sensible by setting Stack Series setting to 100%.
#
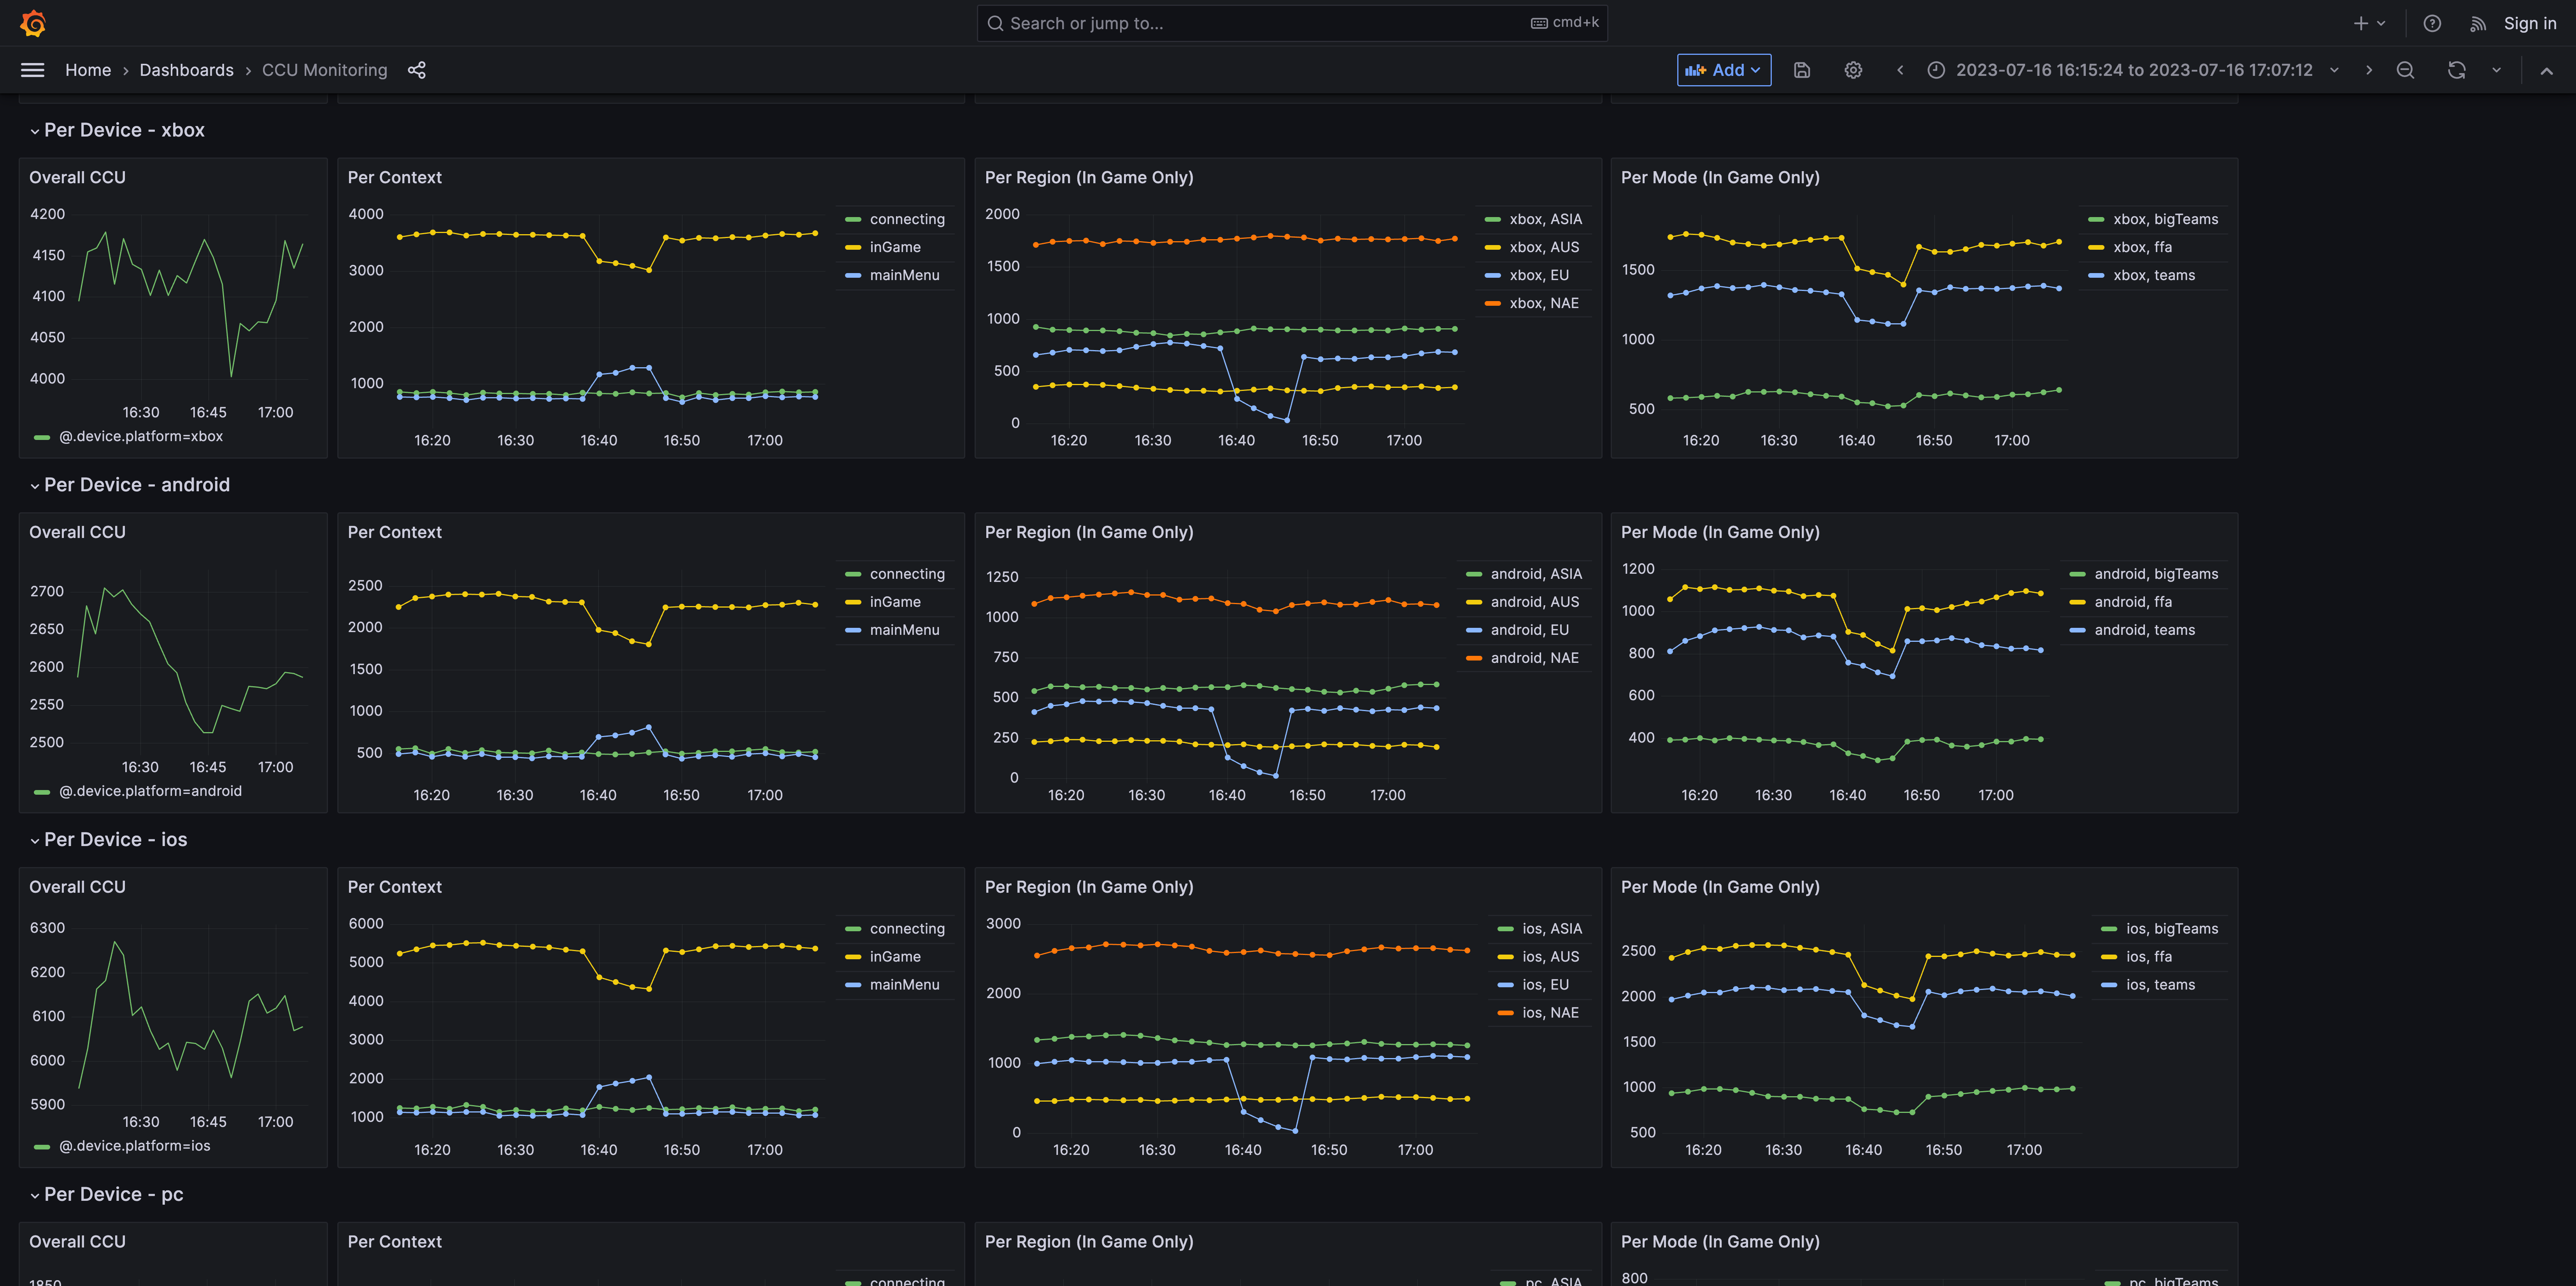
Repeating Rows
A powerful feature the Grafana plugin provides is compatibility with Grafana's ability to "repeat" rows of panels.
Let's say we want to be able to dig into individual platform CCU stats, because we know that each time a new version goes out, we see bugs pop up differently across devices.
Firstly, ensure our high level charts are all grouped together. To do so, add a new Row, I named it Overall.
Now, we're going to add another Row, click the ⚙️ and choose to name it Per Device - $Devices, and choose our Devices variable under Repeat for.
We're going to add 4 charts here, Start by duplicating our charts from above, 1, 3, 5, 6
When you first drag them into the newly repeating row, you may notice they have a lot more serieses - one per device + context or region etc... This should go away after the first refresh.
You want to ensure each of these copied charts are set up to link the @.device.platform filter to the Devices variable.
Keep in mind your changes have to be made to the first row, and as they are saved, they will duplicate to the repeated rows.
This ability to do repeated panels is very powerful, and makes building in-depth dashboards a breeze.
#
Conclusion
From this one event, we'll be able to observe in near real-time the behaviors of our players and monitor for changes that may indicate more systemic problems. We didn't even go over the use of the various other aggregations we're able to achieve. The heartbeat also has tremendous value in batch/warehouse analytics. If there's one event to get implemented into your product and analyzing in real-time with Aggregations.io -- it's a heartbeat.