#
Monitoring App Releases In Real Time
Releasing a new version of anything can fill you with a range of emotions. From joy/pride to stress/dread. Will the customers like it? Will it be successful? How many bugs are there? What if it breaks? We can't really help you with all of that, but we can at least fight off one of the most crucial elements: analytical ignorance. Too many products (apps especially) rely on daily trends to look at behavior changes, some may even have dashboards per-version... But the complexities happen because unlike the web or backend changes - Apps and Games need to propogate. Your users gradually adopt your new version over a period that could be hours to weeks.
We're going to explore the value of keeping your App Version in your Aggregations.io Groupings - and using it for monitoring version adoption.
#
Setup
There's an endless number of events your particular company might send, we're going to look at a universally simple one, an AppOpen event. From this we will be able to monitor propagation as users adopt new versions, as well as monitor certain key notification related metrics. We care about notifications because we know this is the life-blood of our ficticious app. We monitor them closely (and they've broken before).
Our event looks like the following:
{
    "eventName": "appOpen",
    "userId": "abc123",
    "device": {
        "platform": "ios"
    },
    "app": {
        "version": "1.0.1",
        "build": 323331
    },
    "notification": {
        "id": "xxxx-abc-21111231231",
        "type": "friend_invite",
        "friendId": "xyz456",
        "madeSound": true,
        "sentAt": "2023-12-01T05:03:00",
        "sentAgoS": 30
    },
    "bootTimeMs": 715,
    "timestamp": "2023-12-01T05:03:30",
    "wasBackgrounded": false
}
#
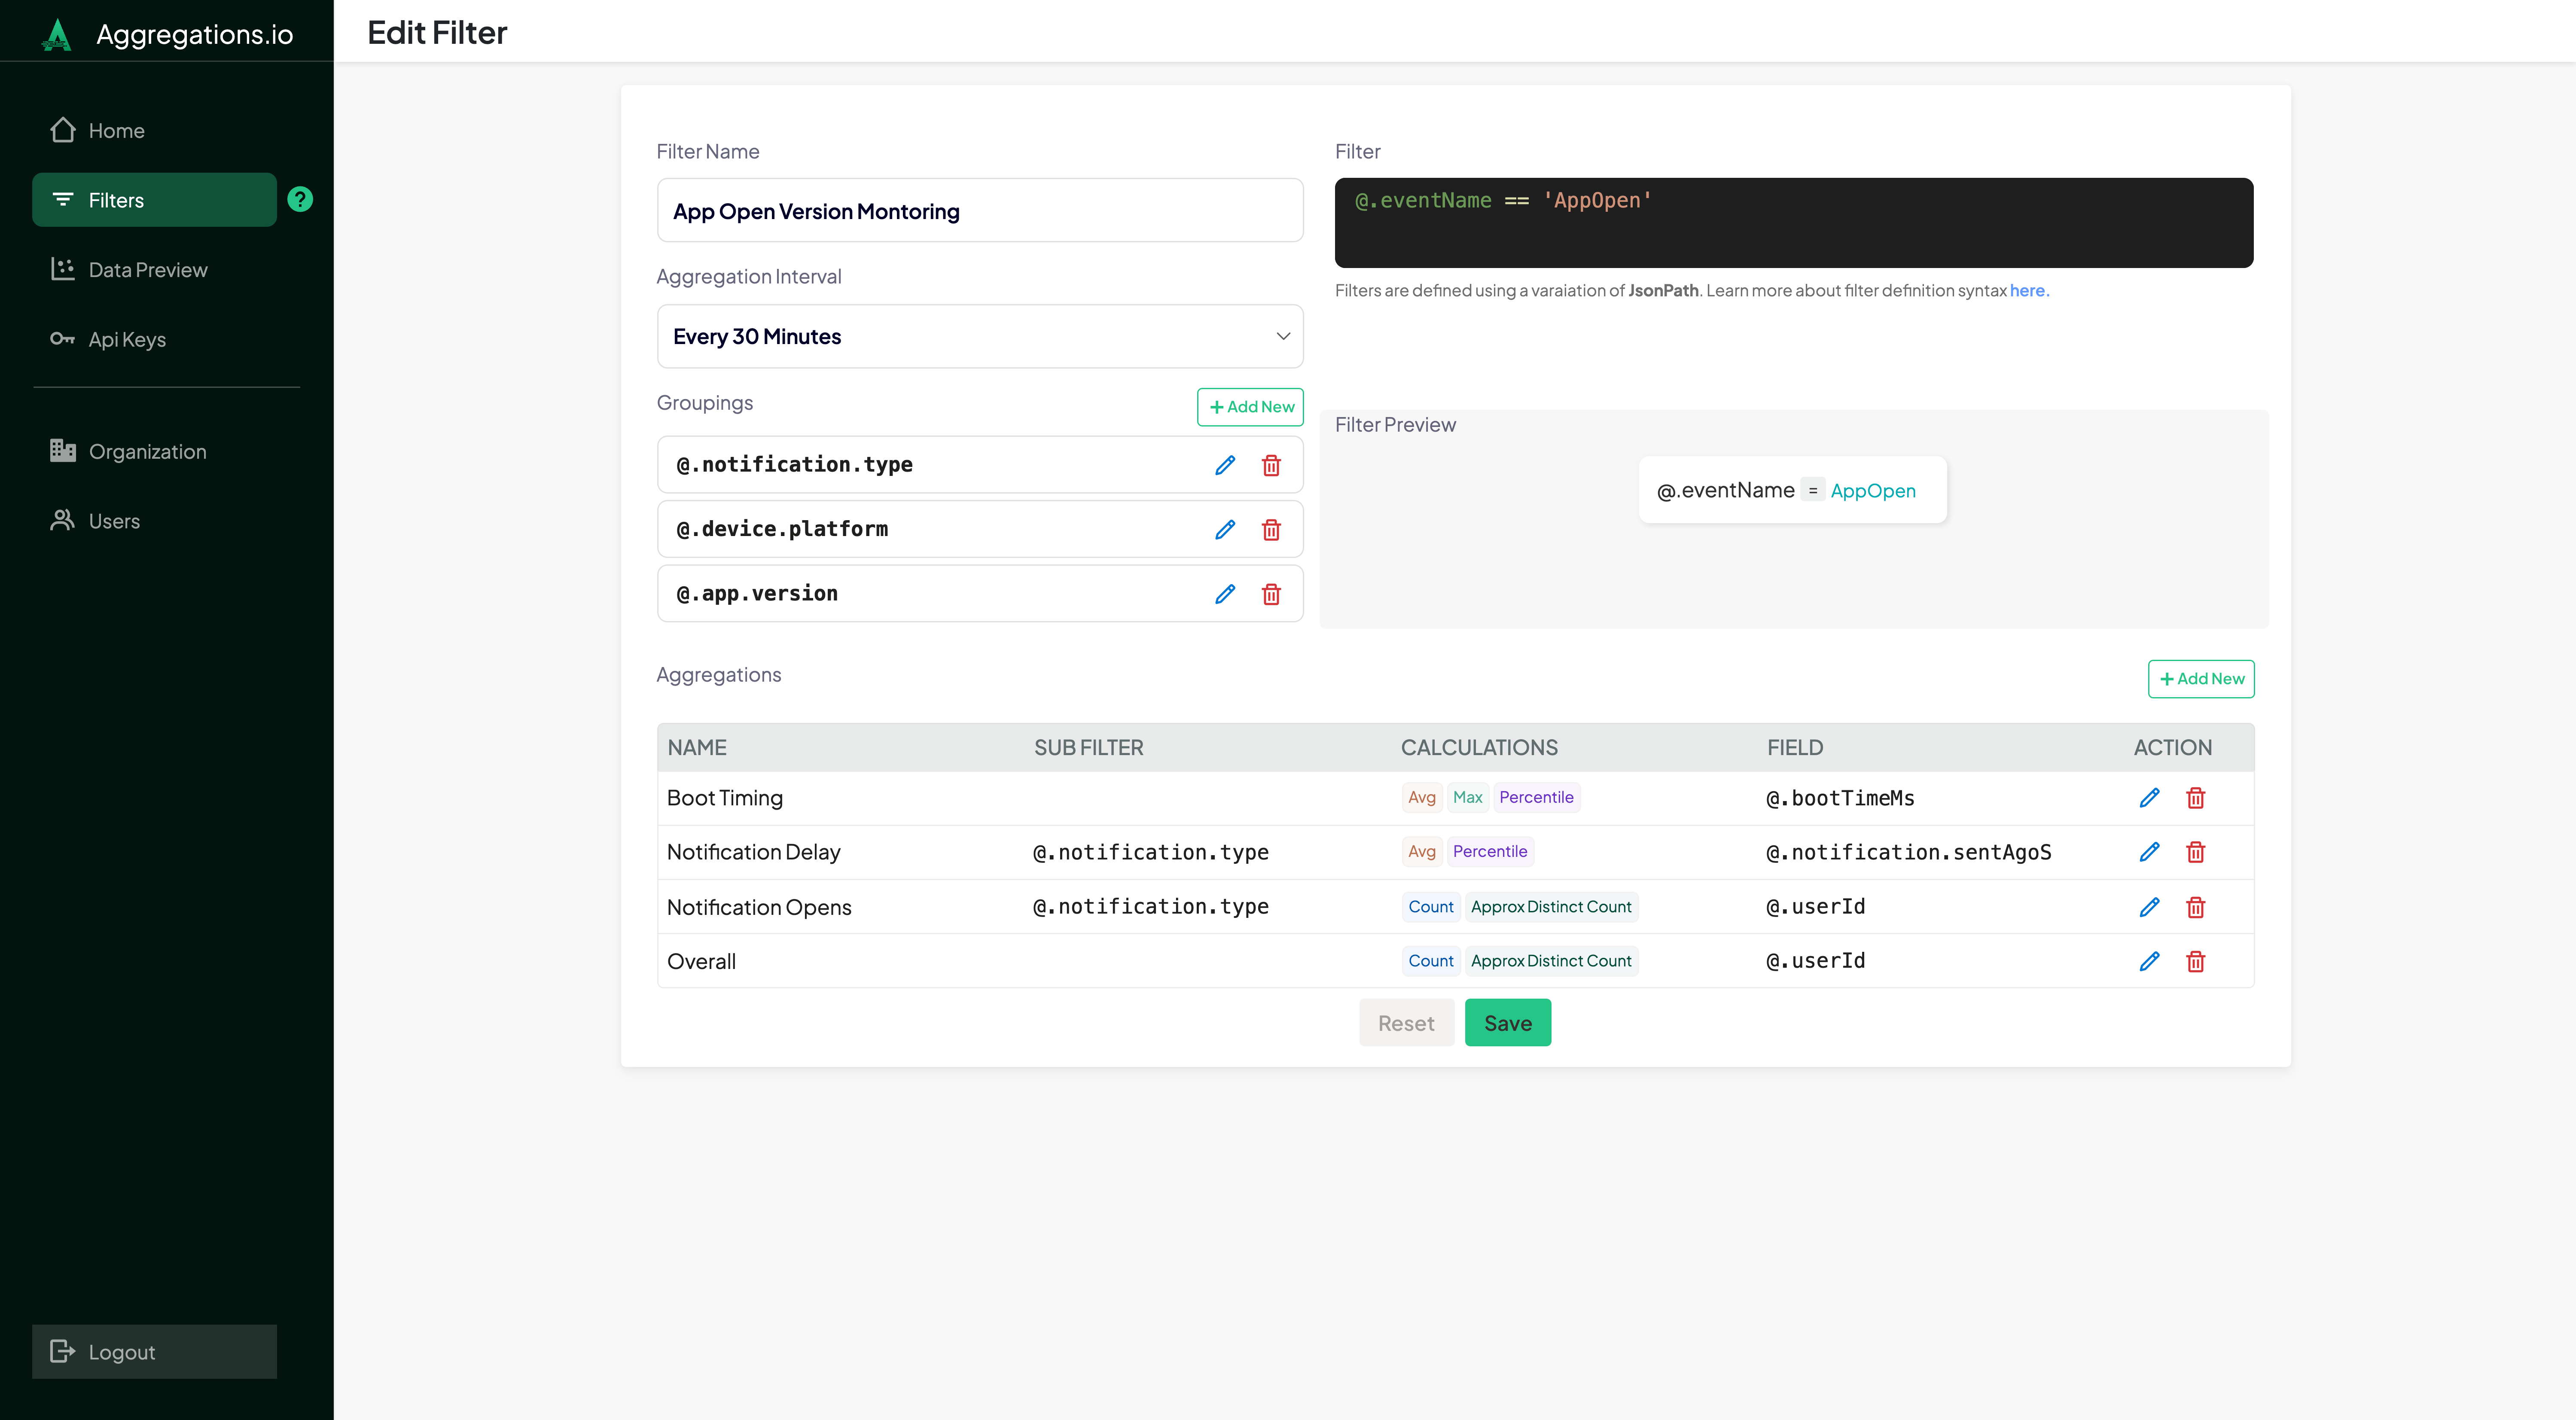
Filter Setup
We're going to setup a filter to monitor our App Opens, and ensure we have a couple notification-related aggregations as well.
Our filter only cares about the appOpen event, @.eventName == 'appOpen'
We're added groupings for @.app.version, @.device.platform & @.notification.type
The interval is set to Every 30 minutes for a few reasons:
- We don't release new versions that often, and want to ensure we gather enough signal before recognizing a new one
- We expect some noise in this data, since we don't force older versions to upgrade
- We intend to look at weeks or months of data at a time, and a larger interval will make retrieval more performant
#
Aggregations
The aggregations we set up as a sample represent some of our high level and most important metrics:
#
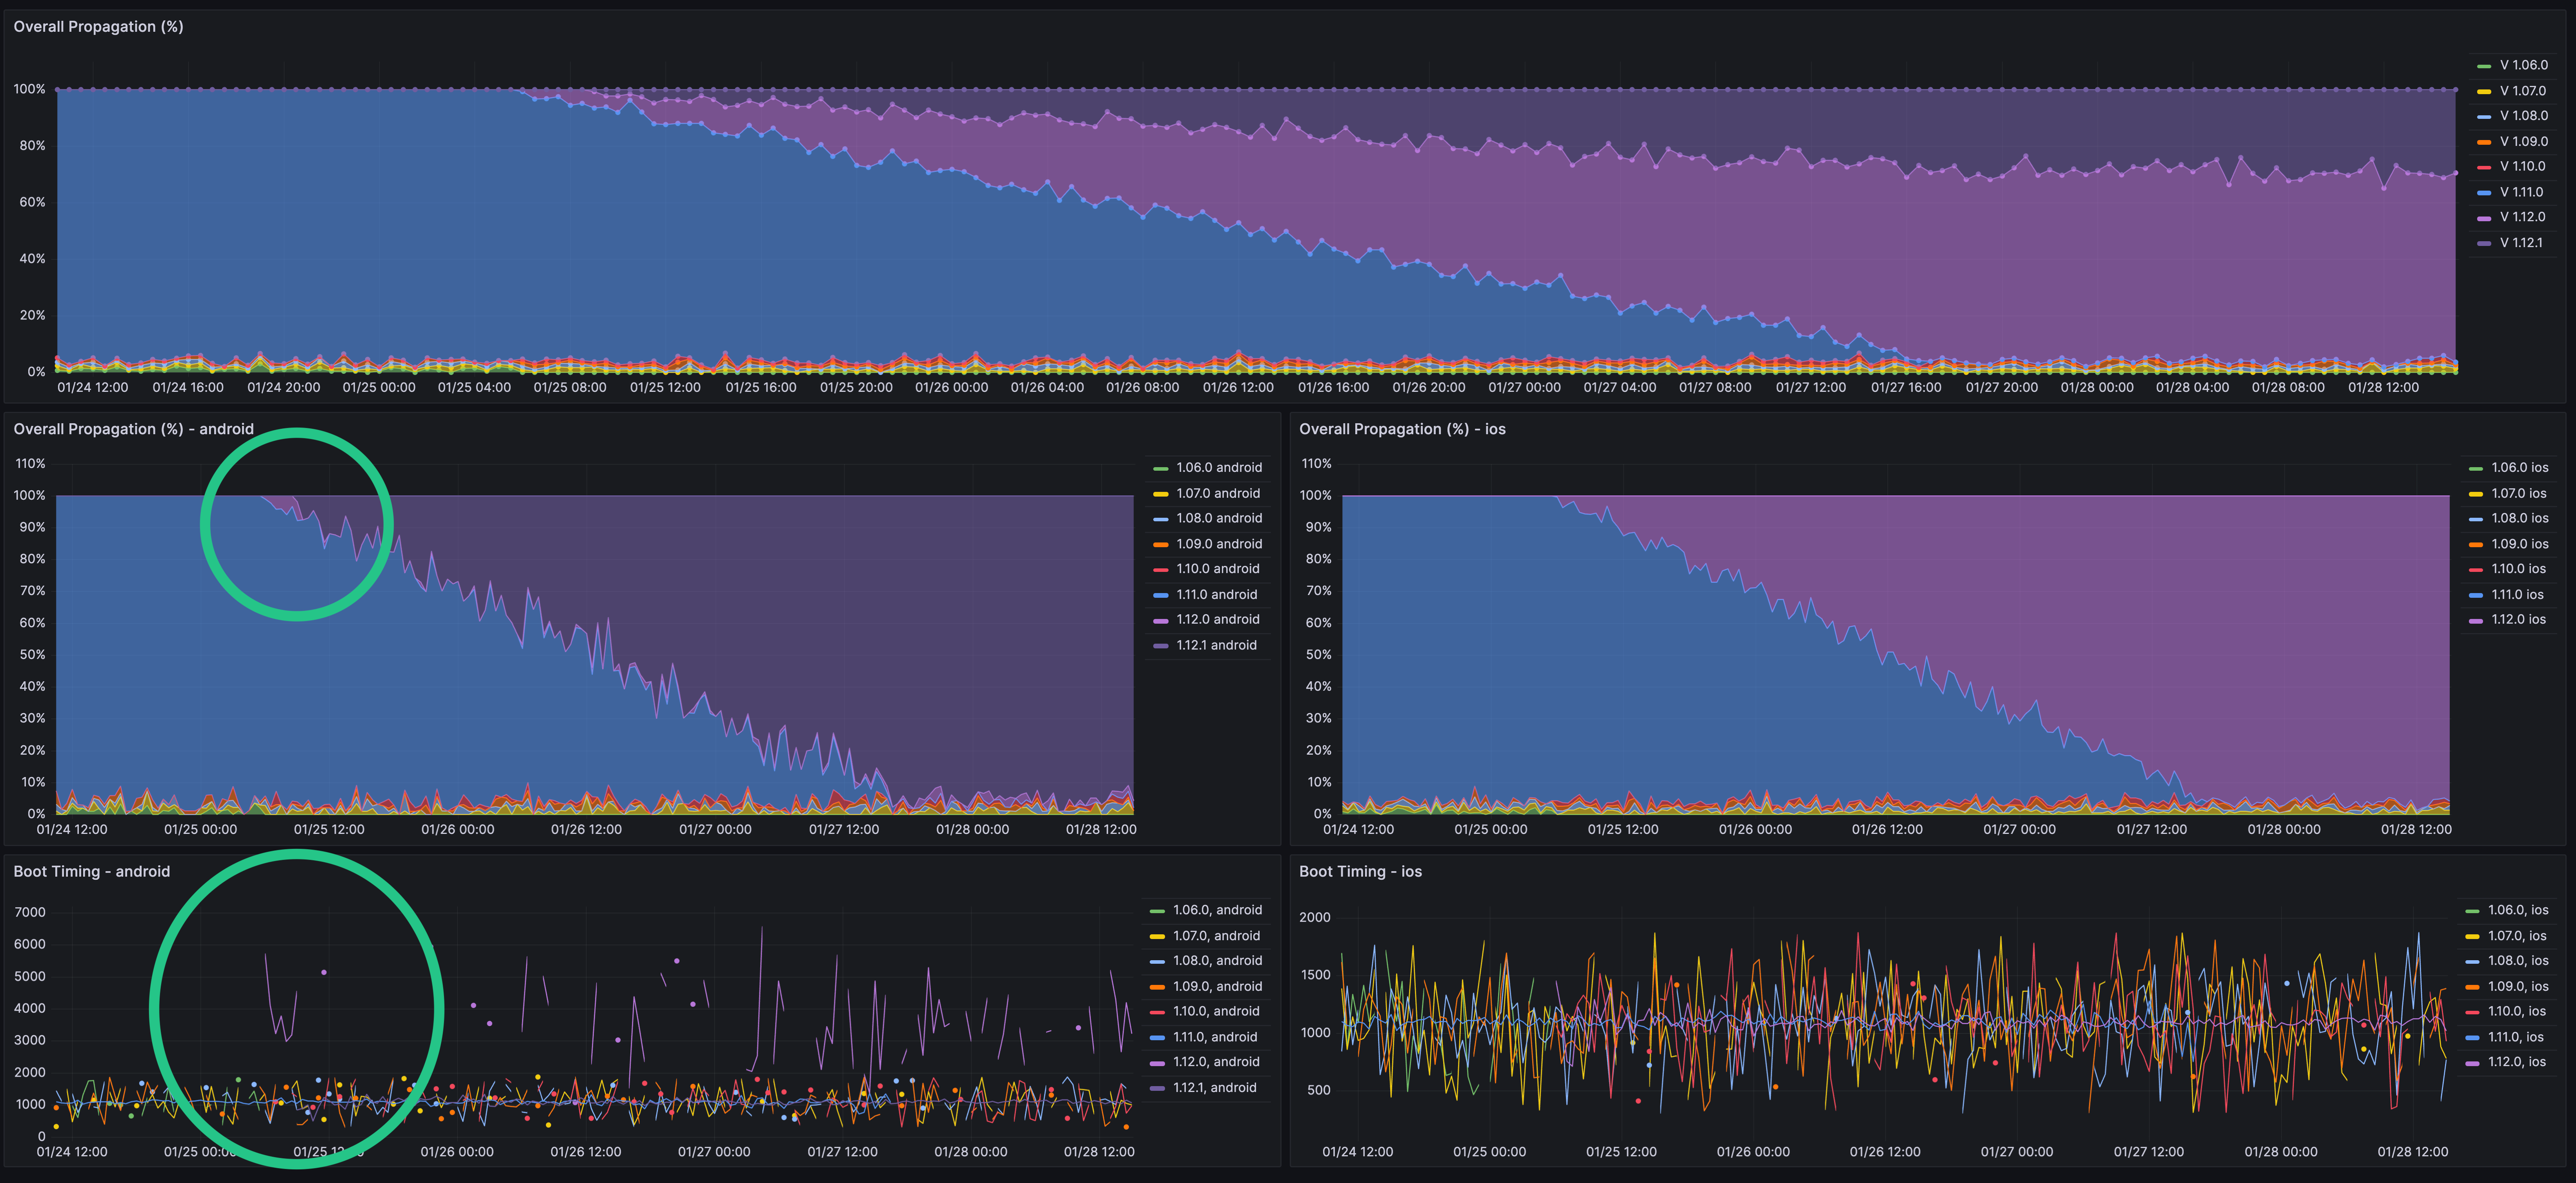
Grafana Dashboards
We're not going to dive too deeply into the setup of these dashboards, check out the CCU use case for a step-by-step guide there.
We ingested random data, simulating slow rollout of new versions every ~10 days, with randomness for pretty much everything.

#
Something looks funky.
Good eye! We attempted to simulate an issue with version 12.0.0 on android.
If we zoom in to when that version first began rolling out, there was a noticable increase in Boot Time. Because this wonderful company is a customer of Aggregations.io, they're able to monitor this and put a halt to the rollout almost immediately. They fixed the bug and released 12.0.1 soon after. Note: because they don't force upgrades, there's still some noise in the data, since users have 12.0.0 in the wild - but the propagation charts show us it is a tiny % of overall users. In a future guide, we'll be diving into how to address this type of data artifacting.
#
Conclusion
This was a quick look at how you can use Aggregations.io to monitor your app's releases in real time. We took a simple event like appOpen and extrapolated it to monitoring propagation and boot time regressions. Our aggregations also enable notification monitoring, which we didn't dig into. When you can react faster to changes in your app releases, you can ensure a better user experience, prevent churn and keep your customers happy.