#
Filters
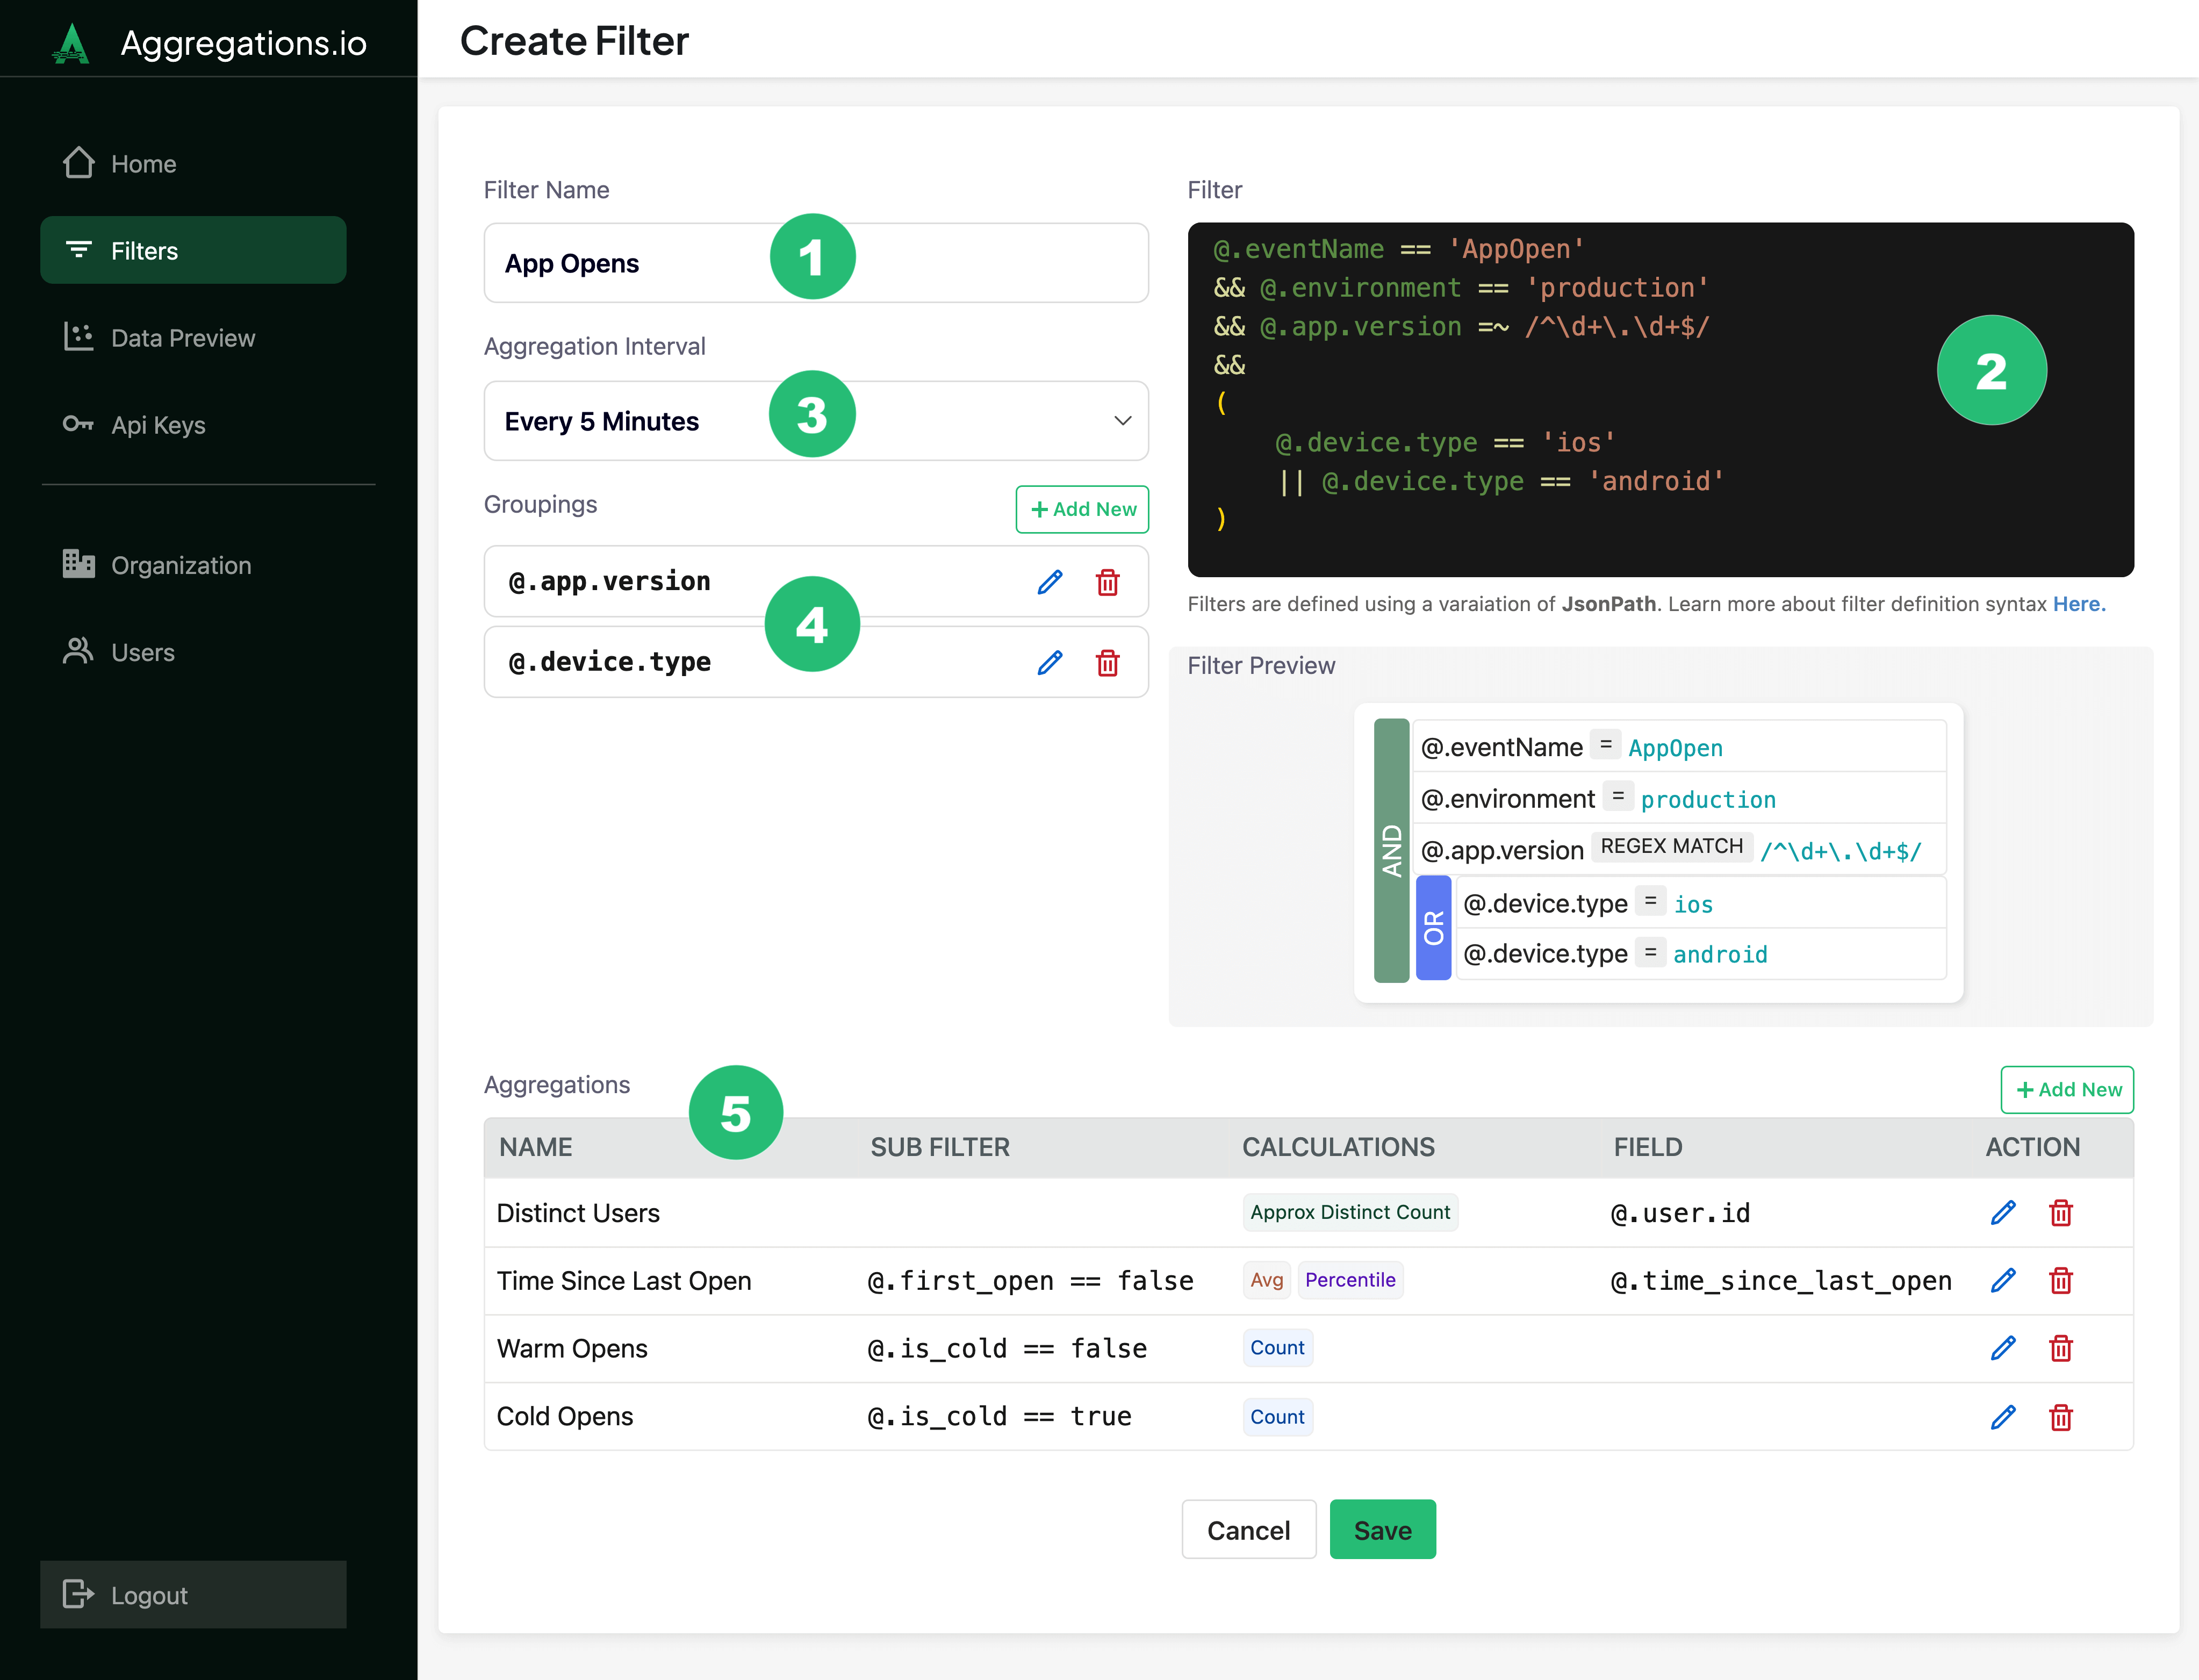
Filters allow you to slice your data based on property parameters you set. On the Filters page, you will find all of your existing filters plus the ability to add new and modify existing filters.
Filters have five components:
#
Groupings
Groupings define how to slice your aggregations, based on properties in your event payload.
When creating a grouping, you can provide an alias, which will be the outputted value when retrieving results via the Metrics API or the Grafana Plugin.
Alias Example
If you've got a deeply nested property like @.properties.device.platform.version - that can take up a lot of screen real estate in a Grafana legend. You may want to alias it to something friendlier like Platform Version.
#
Requirements
- Groupings need to be represented as valid JPath.
- If using a grouping alias, it cannot exceed 100 characters.
- Groupings must be unique within a filter.
- Aliases must be unique within a filter.
- You can have up to 10 groupings per filter.
#
Aggregation Interval
Your aggregation interval refers to the baseline freuqency your data will be aggregated. This can range from 30s to 100 years. You can always re-aggregate your data to a less narrow interval when retrieving metric results with the Metrics API or the Grafana Plugin.
#
Interval Truncation
Interval truncation refers to the process of rounding timestamps based on your aggregation interval. With Aggregations.io all timestamps are truncated to the start of the interval. The effect of this is easier to understand with standard intervals than with irregular, custom intervals. See the examples below to better understand this concept.
#
Examples
If we set our filter to aggregate Every 5 Minutes and send data like the following:
Our results will be:
If we have an aggregation with a special need for 13 minute intervals, such as a full day in our video game being equal to 13 minutes of time in real life.
Truncation will happen in relation to the number of intervals since the UNIX Epoch.
- At
2023-11-01 00:00:00the timestamp in seconds since Epoch was1698796800 - We get the number of intervals since 0 as
1698796800 / (60 * 13)=2177944.615 - Rounding down, the interval start will be
(60 * 13) * 2177944=1698796320 1698796320is2023-10-31 23:52:00
The 13-minute interval will range from 2023-10-31 23:52:00 until 2023-11-01 00:04:59.999 and any event sent between then will be aggregated into that interval.
Aggregations.io weeks start on Mondays. For all events ingested in a given week, the timestamp will be truncated to the Monday of that week at 00:00:00 UTC.
#
How to Choose?
Choosing the right aggregation interval is key to obtaining useful and accurate results. You may be tempted to choose the lowest granularity possible, but that isn't necessarily best. To choose an interval that best fits your use case, review the following considerations:
The shorter the interval, the more granular the aggregation results will be. Longer intervals create a broader perspective and better identification of overall trends. If you choose an interval too short for what you want to measure, you may wind up with noisy or lacking data. If you choose an interval that is too long, you may smooth out important variations.
For example, if your desired aggregation is a count of daily active users, but you collect data every hour, your aggregation interval would be daily. If you selected an interval of minutely, you would lack results in data for several intervals.
Consider the robustness of your data producers. In a perfect world, your producers may emit data once a minute, but in the real world, this may not be practical. For example, client-side events are imperfect, and electrical sensors may suffer from interference. In these situations, we may want to use a slightly larger interval, such as every two minutes, to mitigate that variability.
Higher-level aggregate forecasts are typically easier to create and more accurate than more granular forecasts. So for forecasts, use the longest interval that still satisfies your business case.
For example in retail supply chains, forecasts often focus on weekly sales because supply trucks deliver once a week. In this case, we don't care about sales on any particular day, so we choose weekly. Choosing daily and aggregating those intervals to weekly after would mean biases from the dailies would get compounded.
To detect irregularities, consider an interval that adheres to your data volatility and fluctuations. For example, if you want to analyze daily patterns in website traffic, your aggregation interval would be daily. Choosing an interval that is too long may not accurately capture those changes because it smooths out important variations.
Consider how you want the aggregation results to be presented in reports or visualizations, and who they are for.
Visualization: If you're interested in seeing monthly sales performance in the form of a line graph, daily metrics would be more readable than minutely.
Reporting: Align your interval with your reporting frequency. Teams may want daily reports for operational monitoring purposes and monthly or quarterly reports for strategic planning. In these scenarios, you would set your interval to daily for ops-related aggregations and monthly or quarterly for strategic aggregations.
In real-time monitoring situations, shorter aggregation levels are more typical as they allow quicker detection. For example, if you desire to monitor server performance for rapid response to issues, your desired metrics may require shorter intervals such as 30s or minutely. For quality control, where compliance standards are critical, shorter intervals allow quicker detection and correction of any deviations from quality standards. To analyze the effectiveness of a marketing campaign, especially digital marketing, shorter intervals allow marketers to make timely adjustments based on real-time performance data. For businesses that require a real-time understanding of customer behavior, such as e-commerce or online platforms, shorter intervals provide better insights into user interactions and preferences.
Interval Notes
- Weekly intervals always start on Monday
- All intervals use UTC (and assume any custom timestamp defined is UTC)
- Any ingested events using a custom timestamp with a value prior to the UNIX Epoch (January 1st, 1970, 00:00:00 UTC) are discarded by Aggregations.io. If you have events prior to the UNIX Epoch, Contact Us
#
Changing Aggregation Intervals
Your needs aren't static, so your intervals don't need to be. You can adjust an interval by editing filters to accomodate your evoling requirements.
Note: If you do plan to change the interval, see the considerations in Modify or Duplicate below
#
Cardinality Limits
Cardinality refers to the number of unique elements or distinct combinations of attributes in a set. In dimensional metrics, this set is the collection of distinct combinations of properties observed for a given metric within your aggregation interval.
Aggregations.io does not have a hard cardinality limit, but will introduce soft, system protecting limits in the future.
#
Modify or Duplicate?
After a filter is modified, your past aggregations are retained, so modifying an active filter may lead to unexpected behavior.
For instance, modifying a filter does not backfill your aggregation's metrics based on the new filter definition. Instead, Aggregations.io will start producing the new metric from the time you save going forward. If you're making substantial changes to a filter or individual aggregations, it may make more sense to duplicate the filter and save a fresh version.
#
Removing a Filter
When a filter is deleted, Aggregations.io will stop producing its aggregations results. This will not instantly delete the existing aggregation's results. Existing results will remain available for consumption, but new results will not be produced.
#
Debug Mode
Debugging JPath can be tricky. When setting up or changing your filters and aggregations, you can use Debug Mode to help.