Sometimes JPath can be complicated. When working with real-time aggregations, you should test your changes before committing them. Debug Mode helps you understand how Aggregations.io will turn your JSON data into metrics.
Debug Mode will check all aspects of your filter definition against the supplied JSON payload(s) and ensure you understand what will be filtered, grouped and calculated.
Your payloads are evaluated client side. The JSON you debug is not sent to our servers.
!!!
Note: If your ingestion is set up to use a custom timestamp field, that will also be evaluated in the debugger.
!!!
As you make adjustments to your filter configuration, your JSON will continuously evaluate.
### Debugging Example
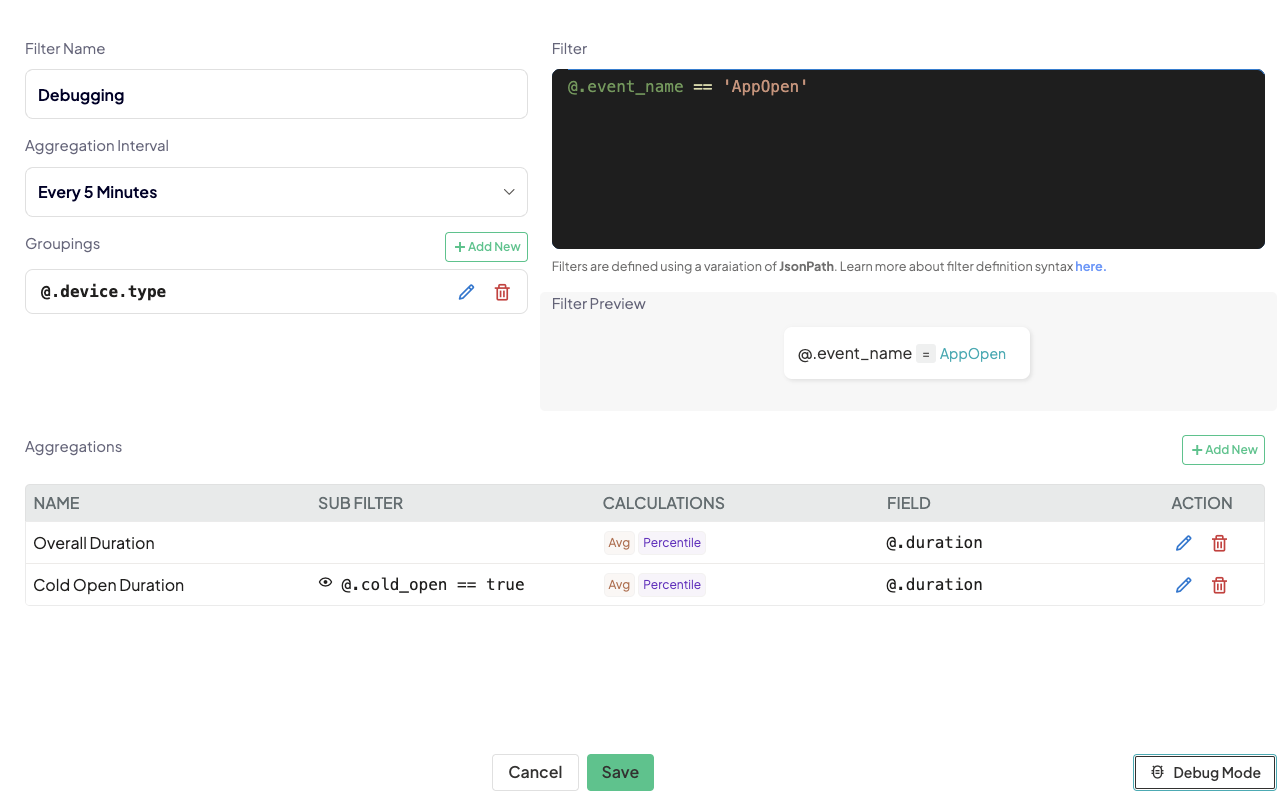
Using this example Filter:
:::spacer-2
:::
Click the `Enter Debug Mode` button in the bottom right.
- Start by inputting your JSON (object) in the left box. Immediately, your fields will be evaluated.
We're going to use the following payload to start:
```json
{
"event_name": "AppOpen",
"ts": 1721491167001,
"device":{
"type": "iOS"
},
"duration":101
}
```
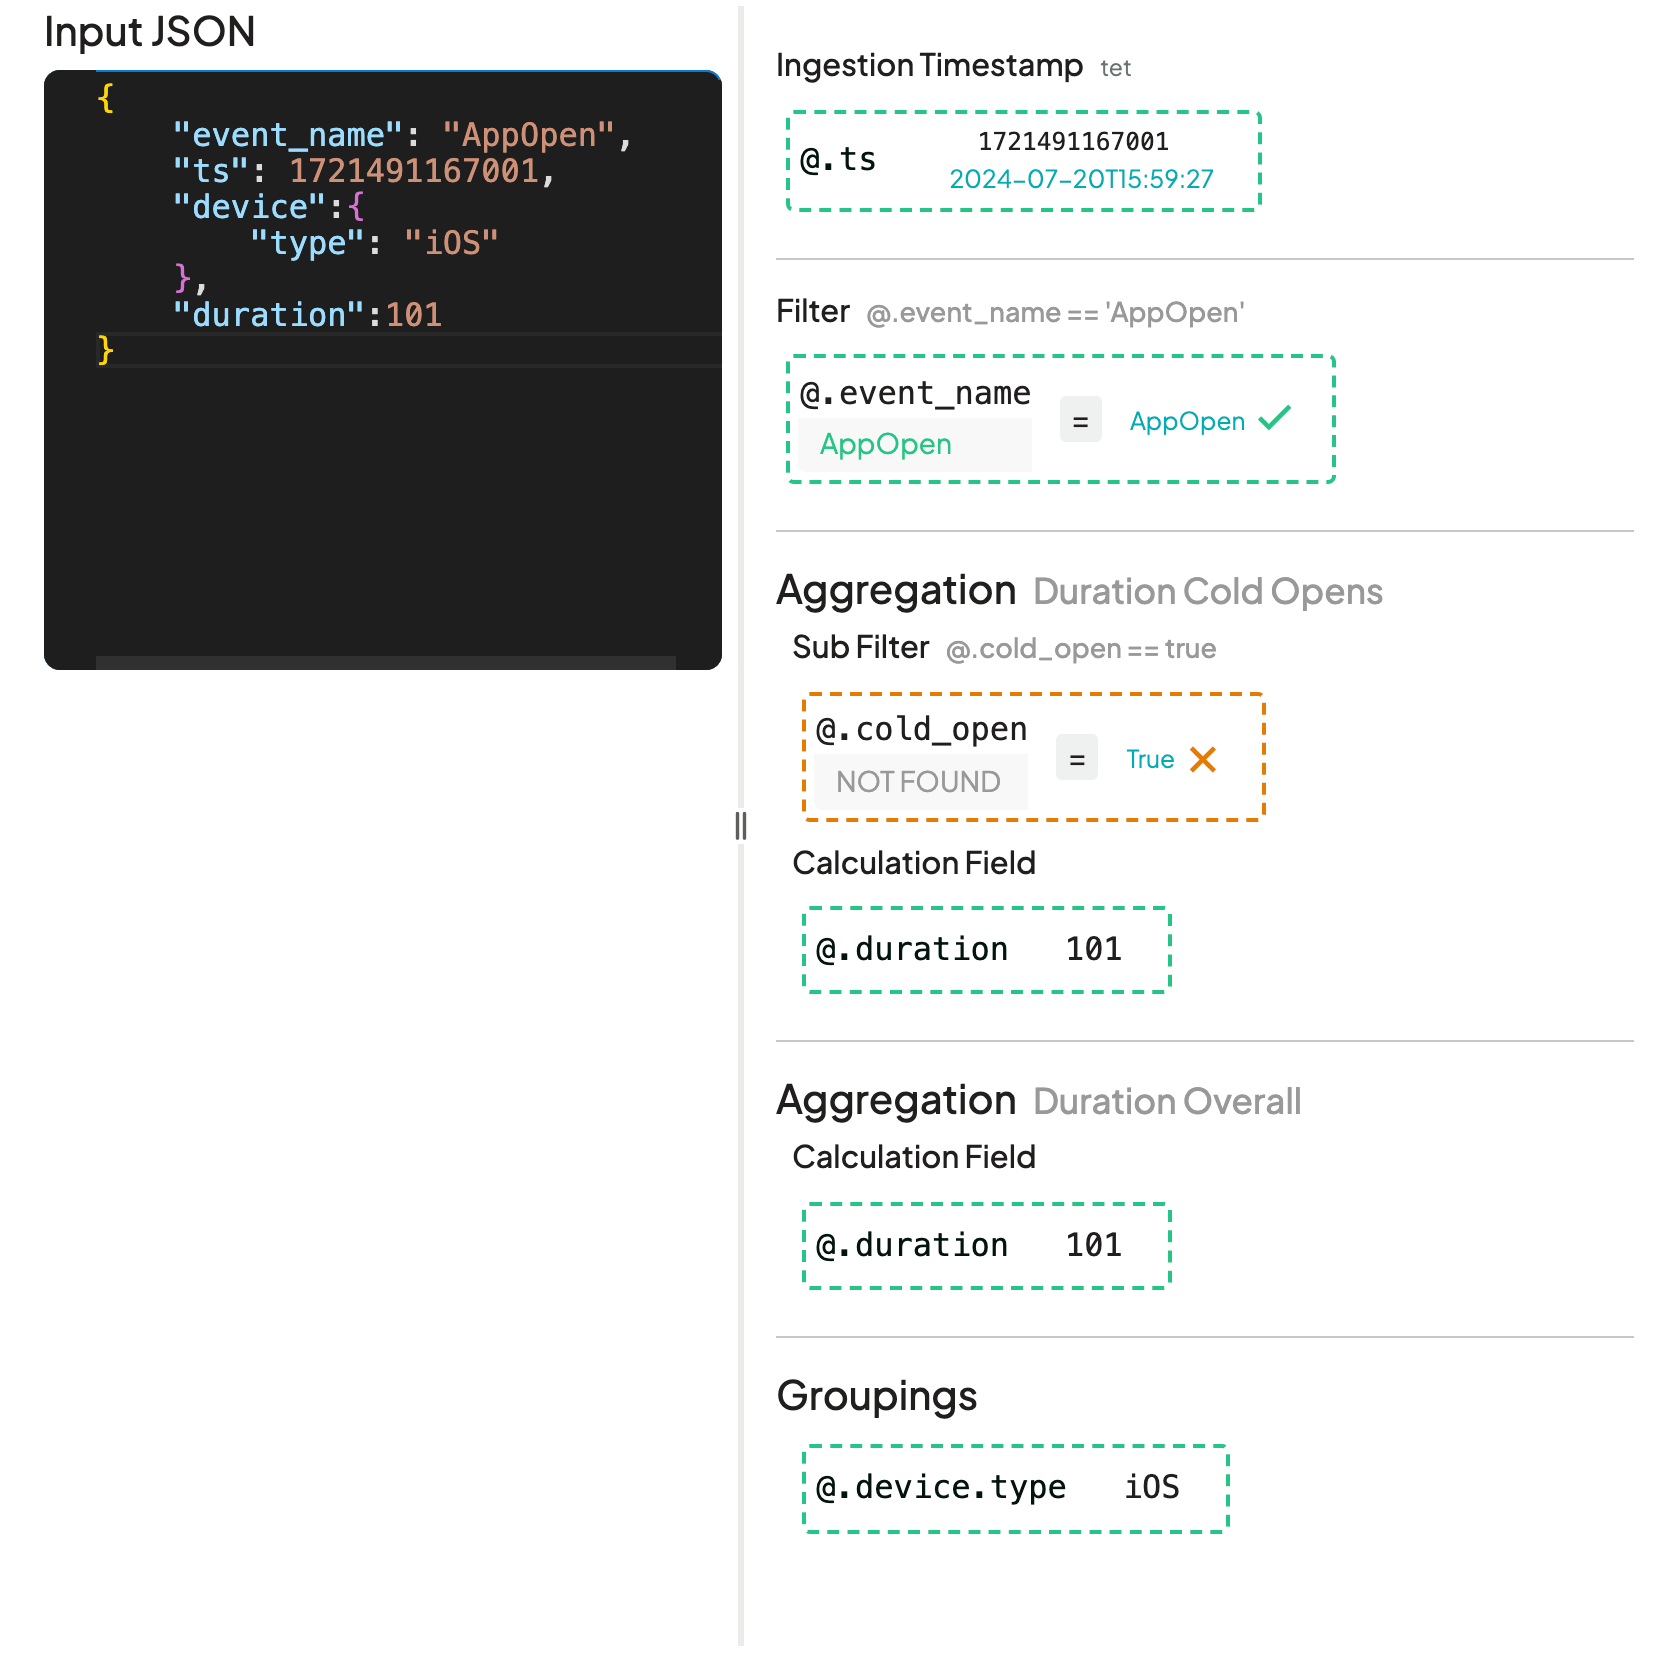
#### We can see:
- Our ingestion (which defines a Custom Timestamp Property of `@.ts` in Milliseconds) was successfully found and properly converted.
- If your property is present, but not parsable to the expected format, you'll see a "Could not parse as number" error.
- Our filter matched successfully
- The `Overall Duration` aggregation, with no sub-filter, extracted `101` as the value for `@.duration`
- The `Cold Open Duration` aggregation, did not match its sub-filter, because the `@.cold_open` property was not found.
- The Grouping value for `@.device.type` is `iOS`
:::spacer-2
:::
#### Using an Array:
```json
[
{
"event_name": "AppOpen",
"ts": 1721491167001,
"device":{
"type": "iOS"
},
"duration":101
},
{
"event_name": "appOpen",
"ts": 1721491167001,
"device":{
"type": "android"
},
"duration":101,
"cold_open": true
}
]
```
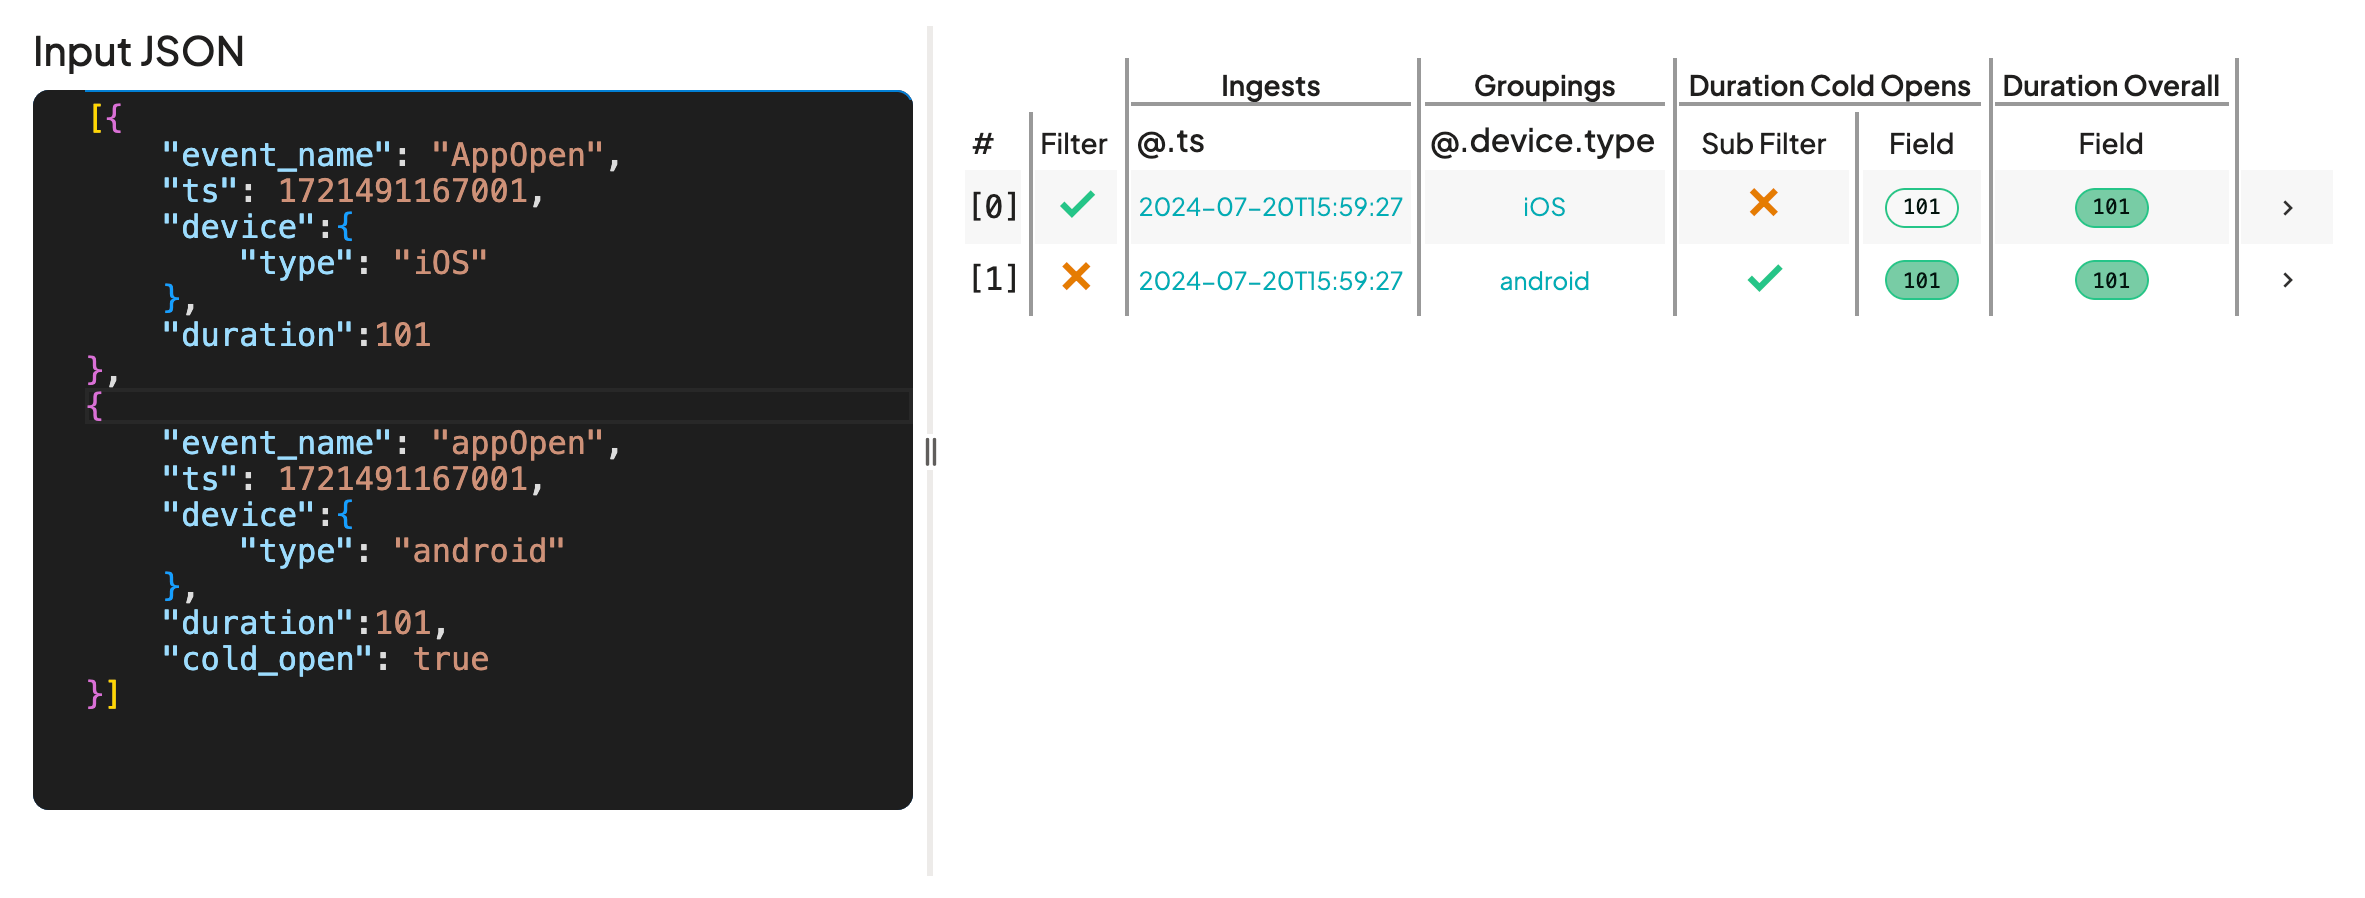
We can put an array of objects into the debugger as well, which will net a more condensed evaluation view.
Here, we can see that the 2nd object matches the aggregations and groupings, but since the filter fails to match (`appOpen` vs `AppOpen`) - no metrics will be calculated for that payload.
:::spacer-2
:::
### Debugging Limits
- At this time, any filter using a regex operator is not debuggable.