#
Events Explorer
The Events Explorer allows you to search through your events and examine their properties.
#
Event List
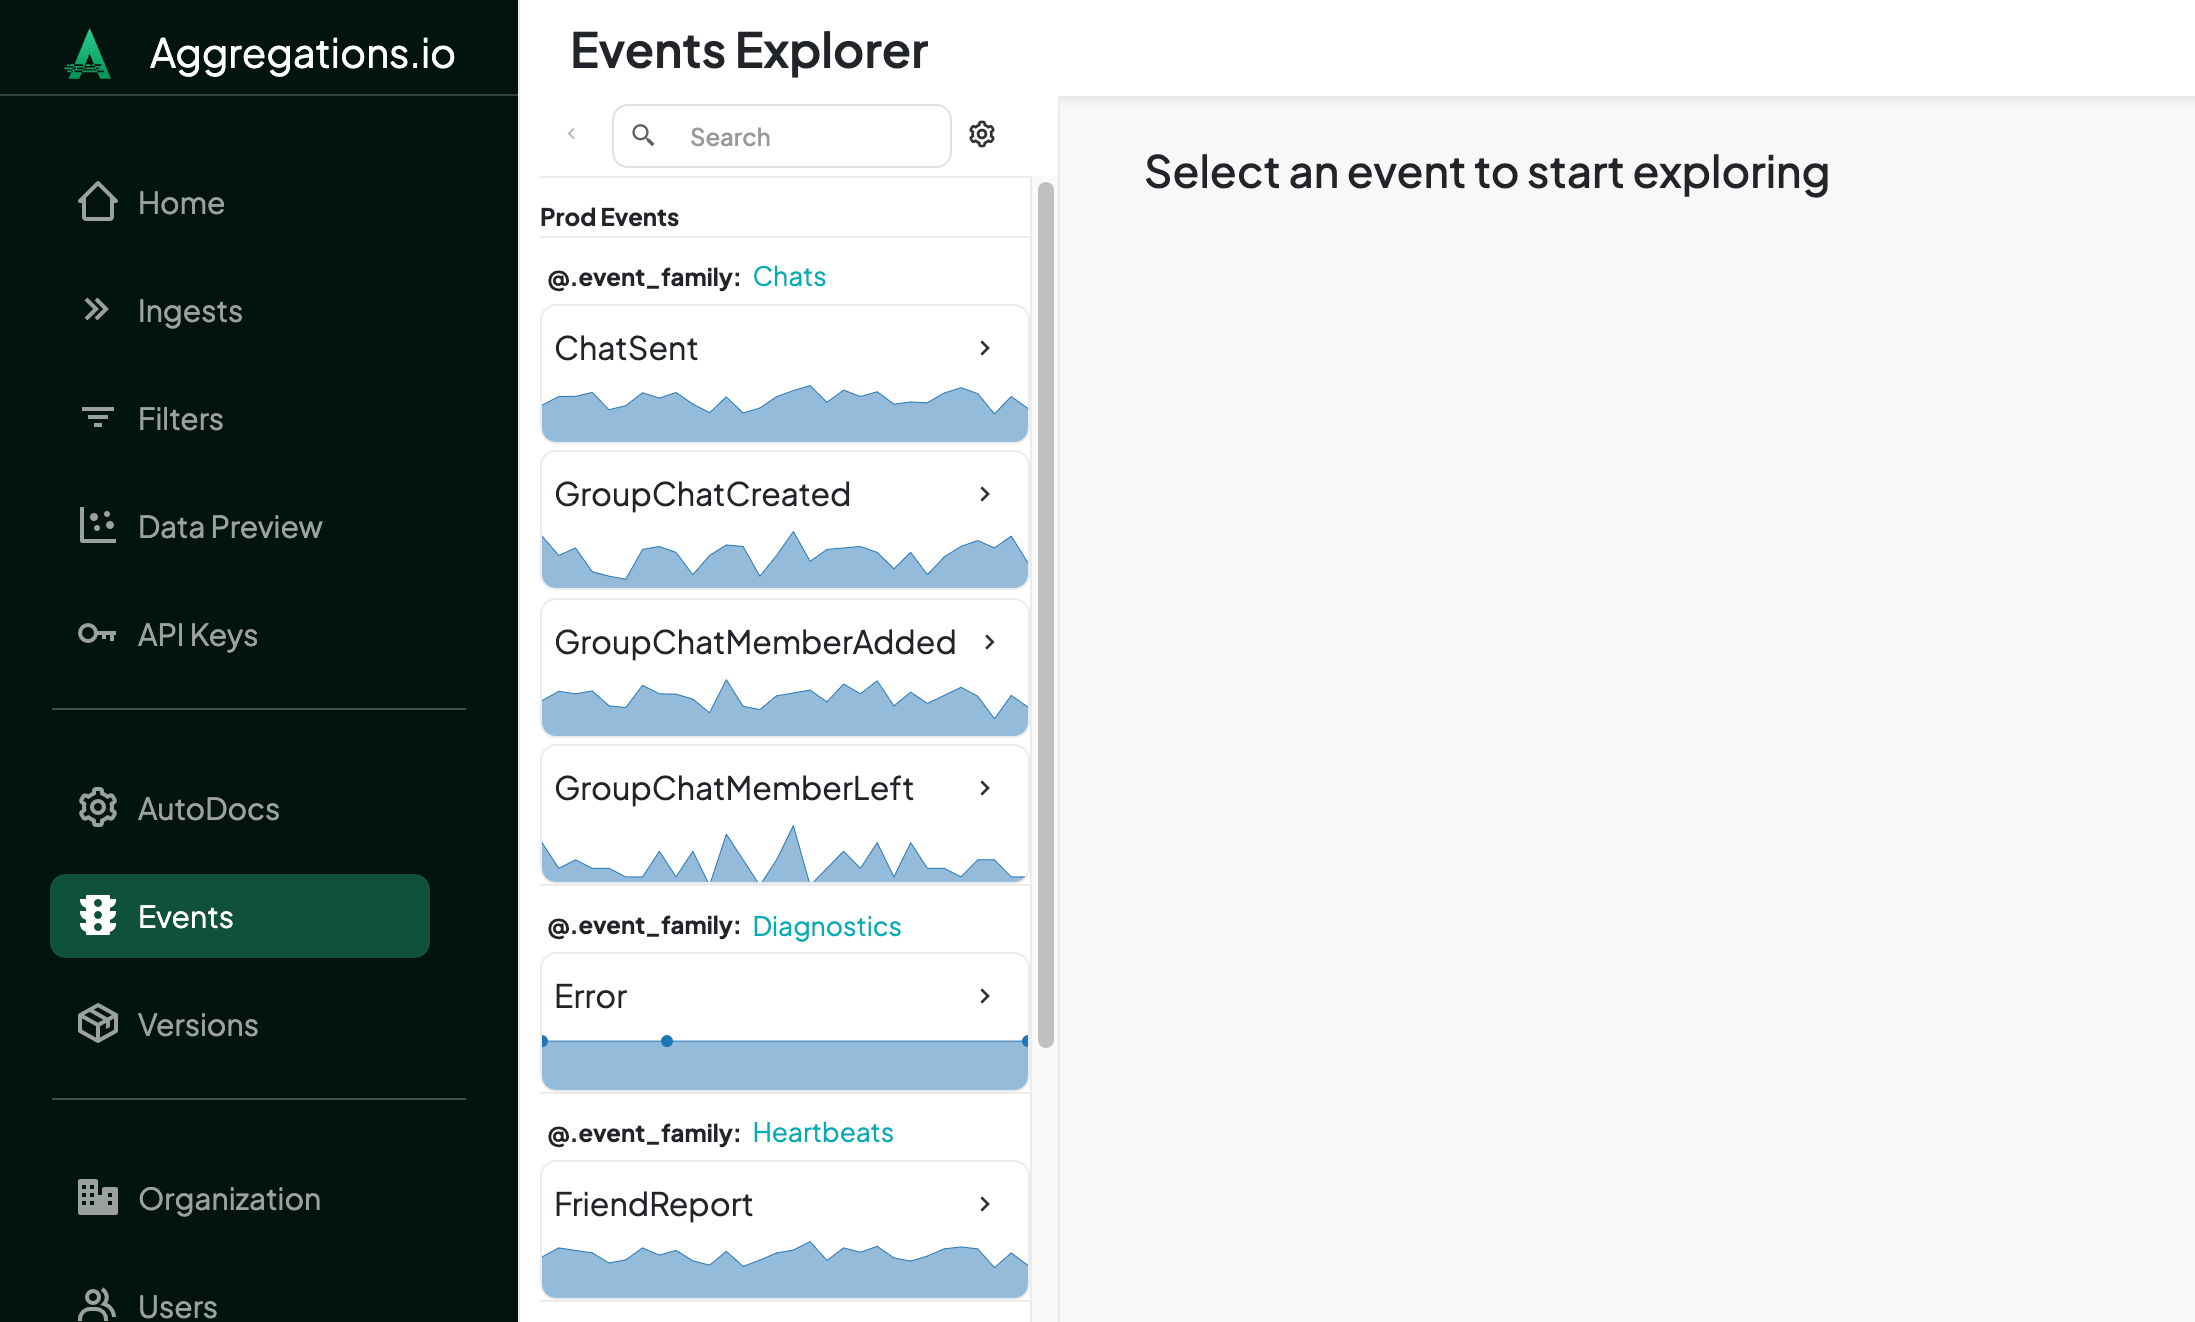
Your events are displayed in a collapsible panel. Events are grouped by config and then levels of descriptors.
In the example below, the Config name is Prod Events and the descriptors are @.event_family and @.event_naem.
Each event includes a chart tracking the number of ingested events per day for the most recent 90 days of data for that event.
#
Searching
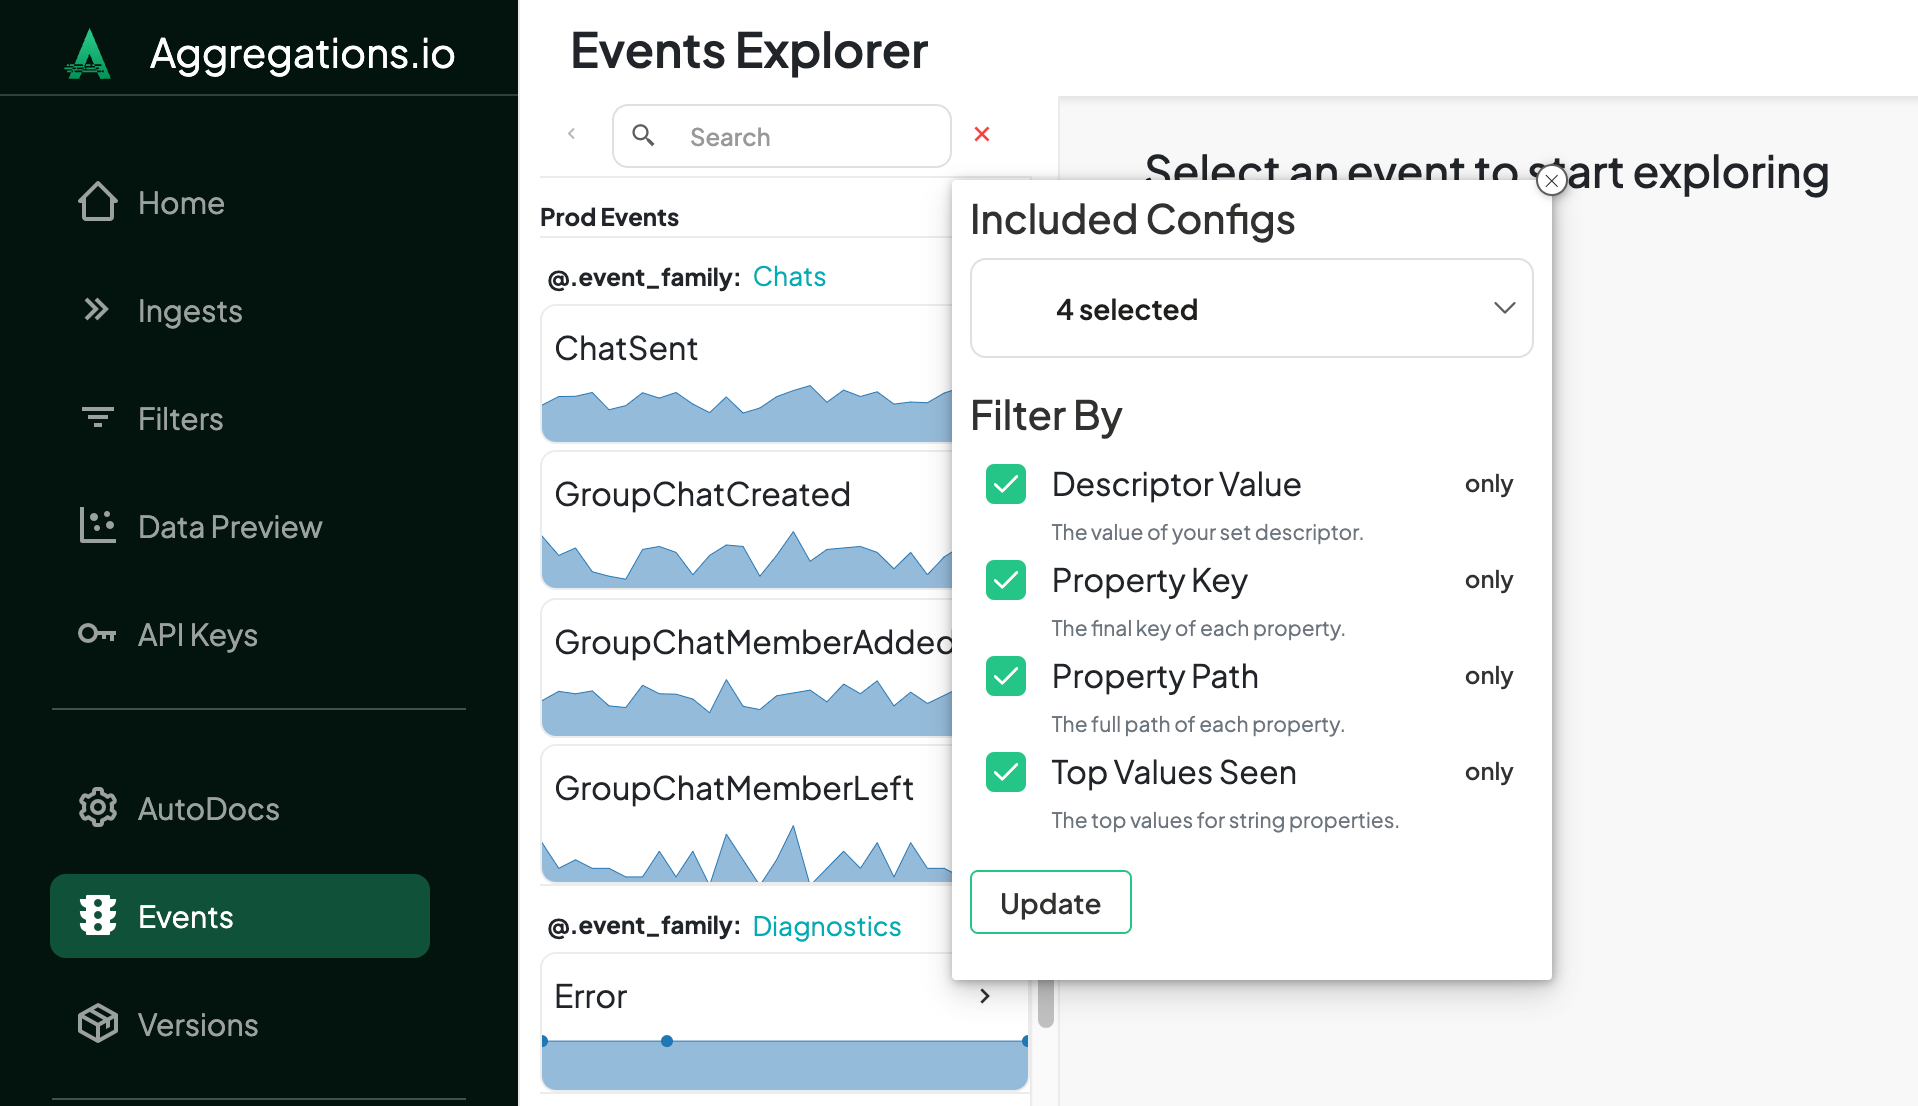
By default, search will look at all elements of your events and their properties. If you want, you can refine your search by clicking the ⚙️ icon next to the search bar.
If your organization is enabled for multiple ingests and you've created multiple AutoDocs configs - you can choose which to include in your search.
All searches are case insensitive and will function as substring matches.
[
    {
        "eventName": "appOpen",
        "device": {
            "platform": "ios",
            "osVersion": "16.0"
        },
        "geo": {
            "country": {
                "code": "US",
                "name": "United States"
            }
        }
    },
    {
        "eventName": "appClose",
        "device": {
            "platform": "android",
            "osVersion": "13.0"
        },
        "geo": {
            "country": {
                "code": "US",
                "name": "United States"
            }
        }
    }
    ...
]
#
Event Detail
When you choose an event from the list, the right side of the screen will populate with the details for that particular event.
#
Version Settings
By default, properties from all non-prerelease versions of the event will be included.
You can click the Version Settings button to open a popover giving you more control over the properties displayed.
You can choose between:
#
Properties
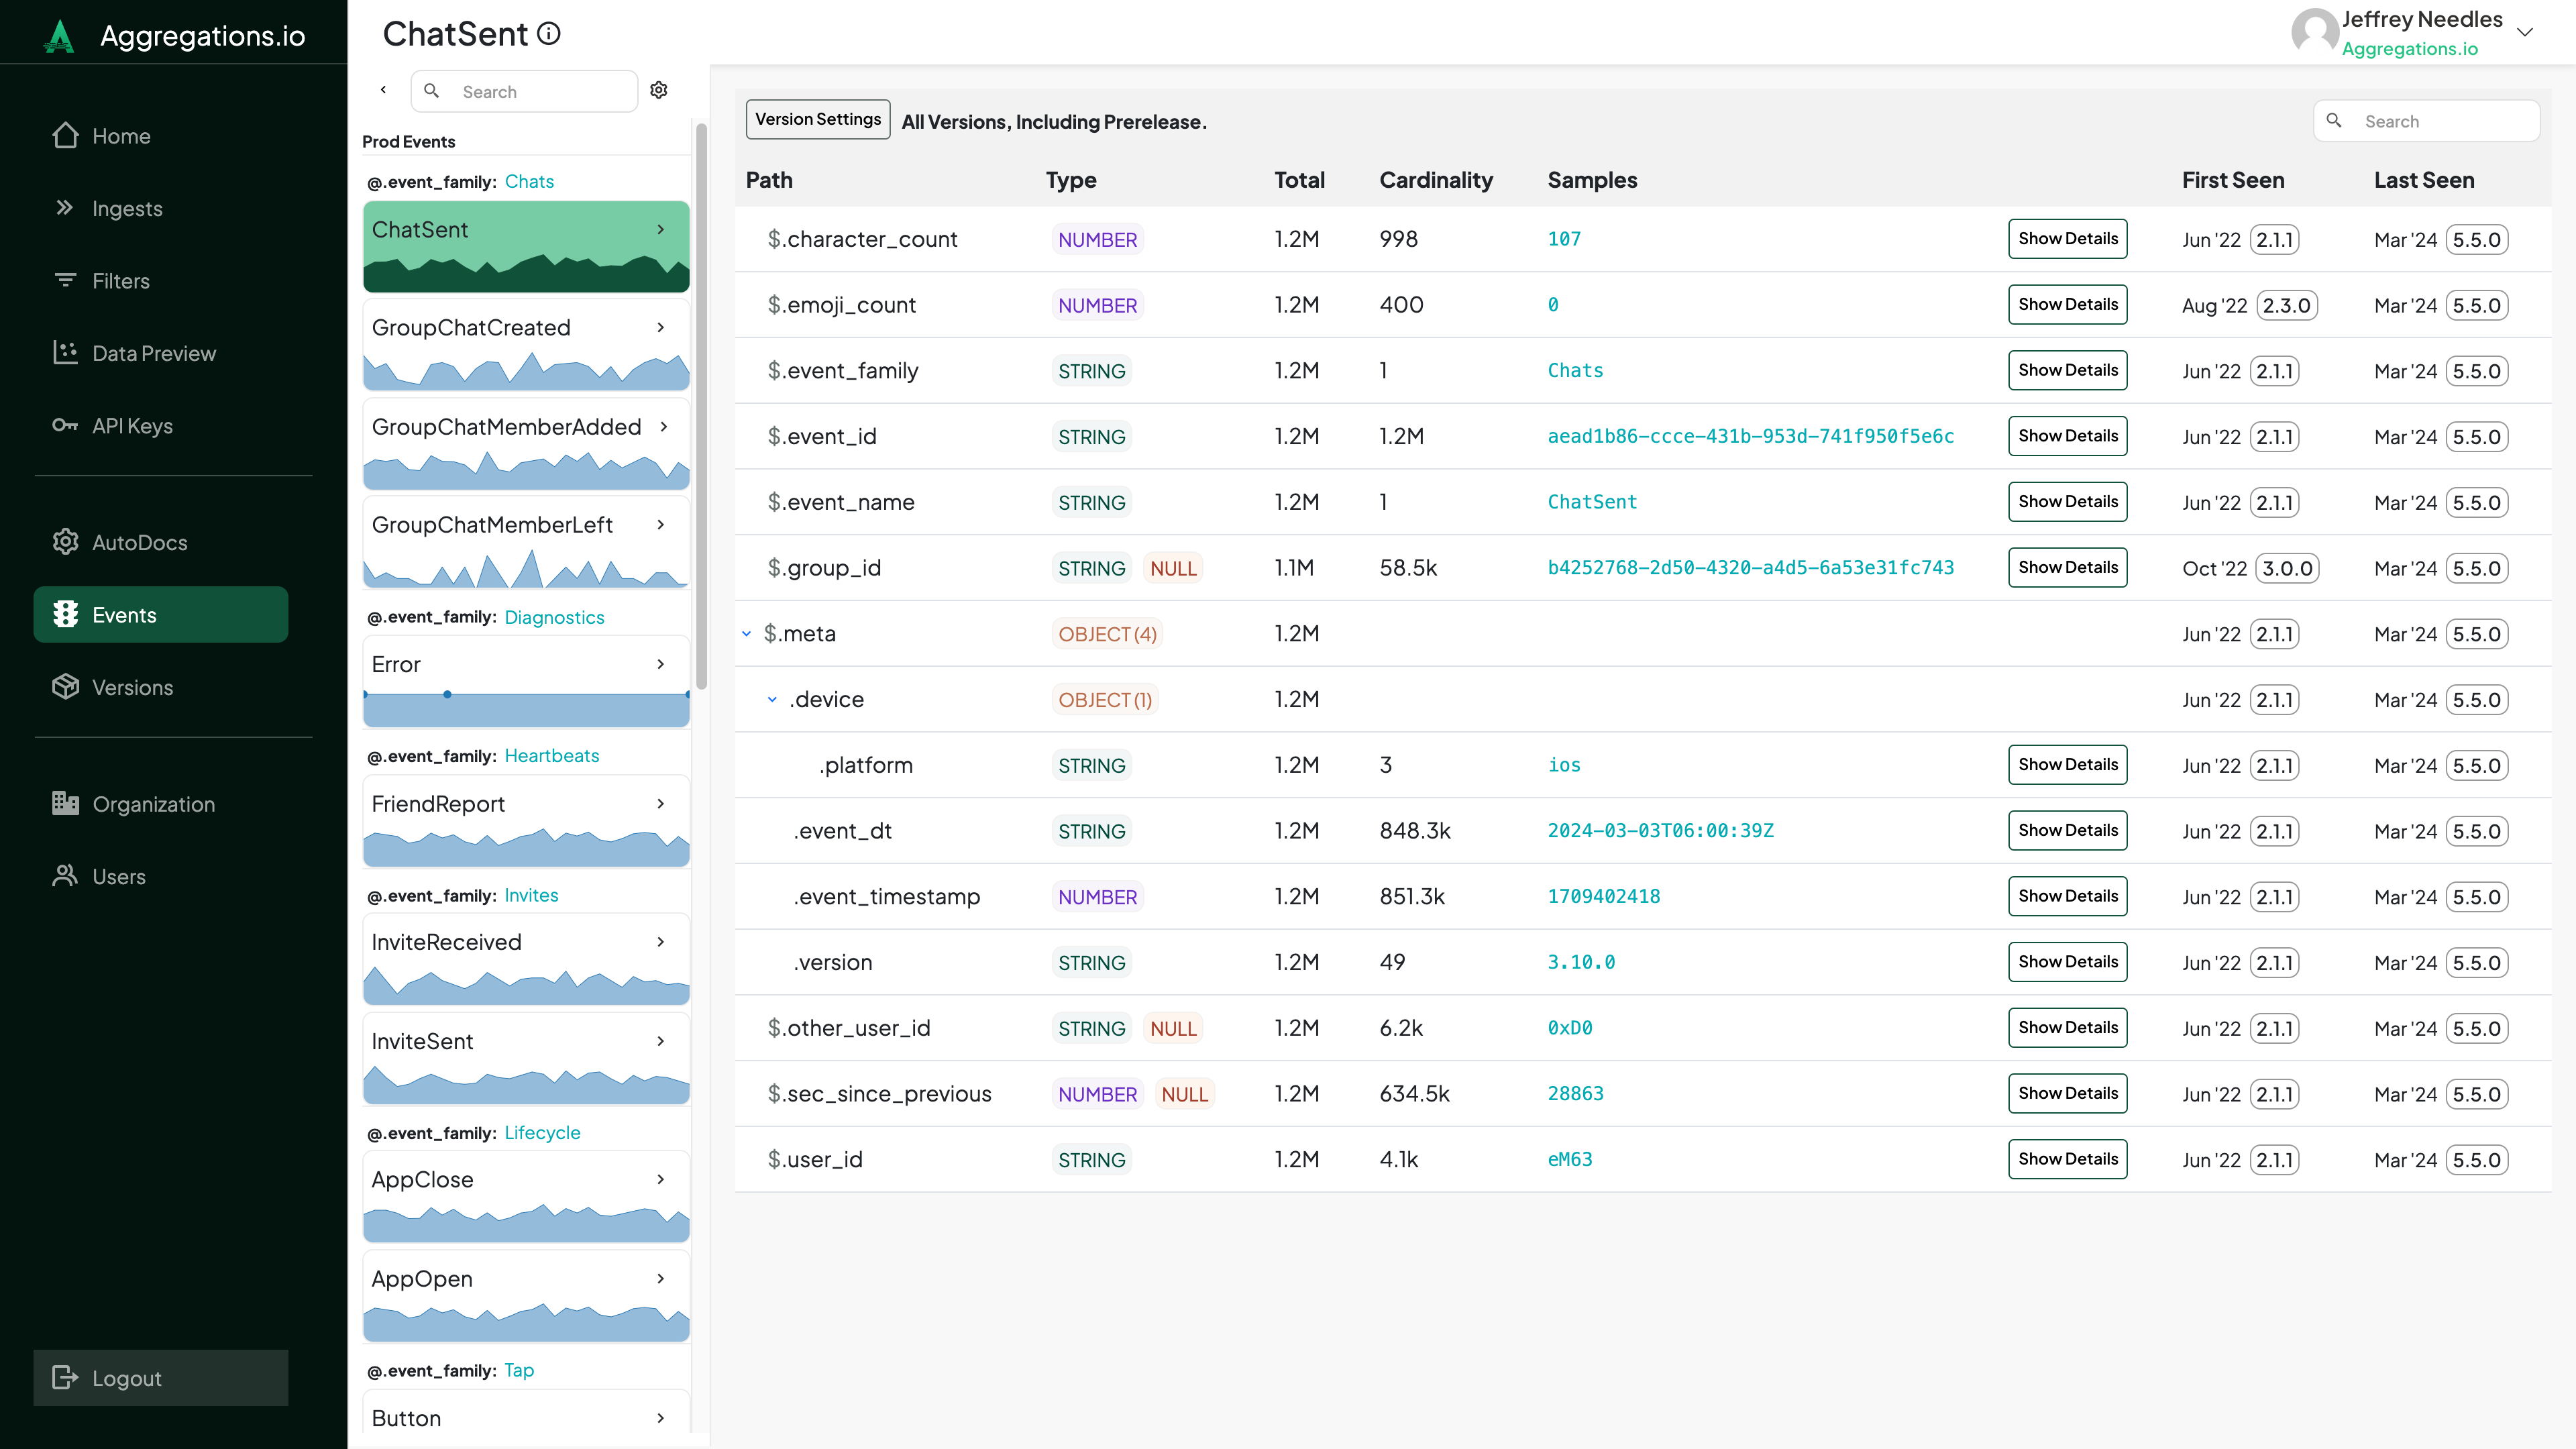
Your properties will display in alphabetical order, following the nested structure as they appear in your events, allowing you to expand or collapse as needed.
#
Columns
#
Types
AutoDocs tracks each property by its type and path, so if you send an event with {"field": "abc"} and {"field": 123} , the field property is tracked twice. When reviewing in the Events Explorer, these are reconciled and combined, and you'll see the relevant fields combined in the table.
If you're curious about the inner workings of type consolidation, see below.
Type consolidation follows these rules:
- Primitive types (String, Number, Boolean) can be consolidated
- Arrays of primitive types can be consolidated
- Objects types are never combined with primitive or array types
- Arrays of objects are never combined with arrays of primitives, primitive or objects
- Nulls will first apply to primitive types (if they exist) then objects.
If you send the following payloads:
[
    {
        "p1": 123,
        "p2": "hi",
        "p3": ["a","b"],
        "p4": null
    },
    {
        "p1": true,
        "p2": null,
        "p3": [123, 456],
        "p4": {
            "i1": false
        }
    },
    {
        "p1": [true, true],
        "p2": 0,
        "p3": [],
        "p4": [
            {
                "i1": 123
            }
        ]
    }
]
We can break it down like so:
#
What about i1 ?
Because p4 is both an OBJECT as well as an OBJECT, the nested i1 property will not be consolidated across the varying parents.
#
MIXED Arrays
If there is an event with an array property whose elements are of multiple types, such as {"field": ["a", "b", 1, 2] } , you'll see a MIXED[] type. Array length samples are still maintained. However, if your array mixes primitives and object types, the sub-objects are not sampled for nested properties.
#
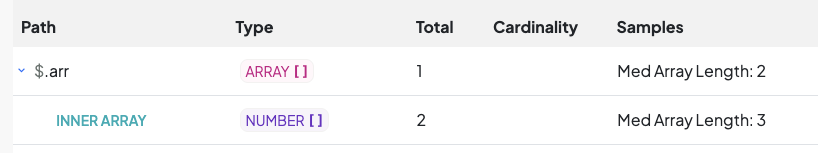
Arrays of Arrays
Arrays of arrays are sampled up to 2 levels of nesting. For the following payload, the resulting properties will include arr with a sample length of 2 and a special INNER ARRAY field, with a sample length of 3.
{
    "arr": [
        [1,2,3],
        [4,5,6]
    ]
}
#
Property Samples
The Samples column will show:
- The
Median Array Lengthfor ARRAY columns - The most frequently seen value for NUMBER or STRING columns
- The % true/false for BOOLEAN columns
- Nothing for OBJECT or multi-type primitive columns.
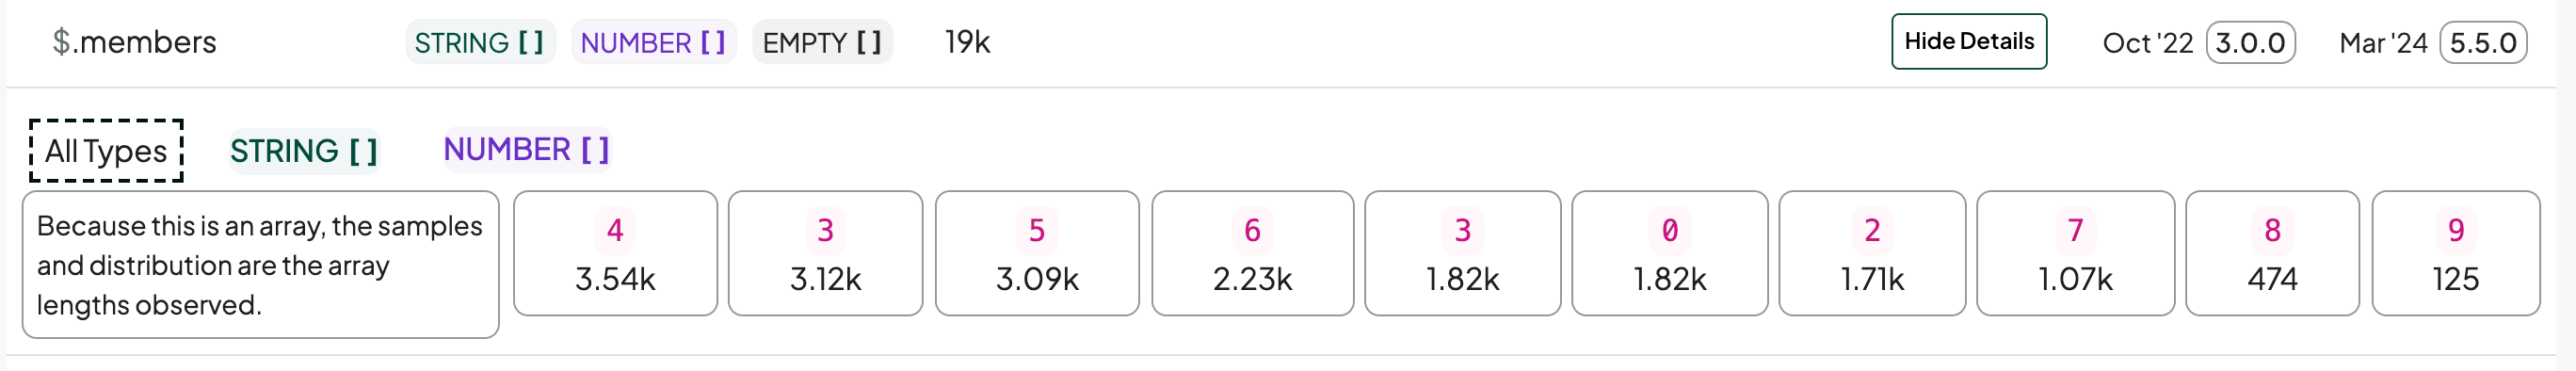
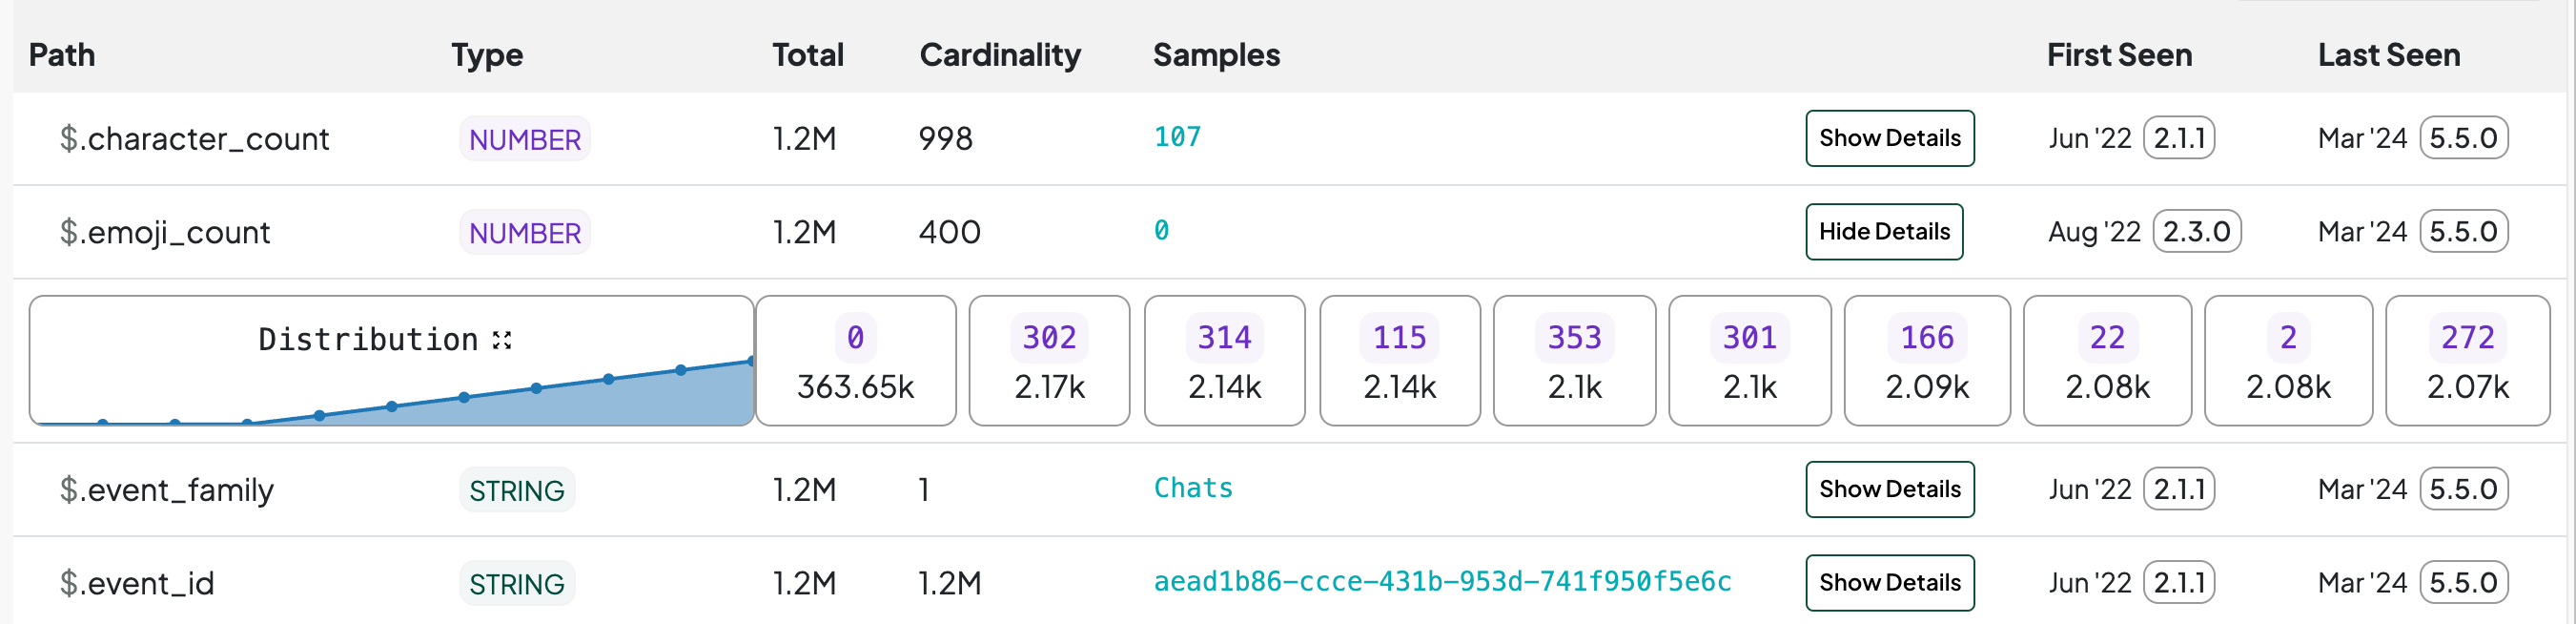
When you click the Show Details button, you will be presented with a panel of the 10 most frequent values observed, along with the number of payloads on which they were observed.
When you view the details of a NUMBER or ARRAY property, you'll also see a distribution of the values observed. This chart tracks the 10th, 20th, 30th... percentiles.
Some properties do not return individual sample counts. This includes properties with more than 1,000 samples whose cardinality is within 5% of the sample count, or more than 10,000 samples whose cardinality is within 8% of the sample count. This usually only applies to properties that change on almost every event, like IDs, timestamps, etc.
#
Multi-Type Samples
When viewing the details of a property that has been consolidated across multiple types, the default view will include the top 10 sampled values across all the types, interwoven. You can switch between the tabs to view samples for individual types, as well as extra detail about the property with regard to that specific type.